Data Analysis
Move from data to insight in minutes. Benchling AI analyzes your experimental results — running statistical tests, fitting models, generating visualizations, and surfacing batch effects — so you can interpret findings without leaving your notebook.
Trusted analysis, built on your data
Analysis that fits your experimental design
Don't get a generic t-test when your data calls for a mixed model. Benchling AI reads your experimental setup — replicates, controls, plate layouts, time points — and selects methods that match: paired tests for paired samples, ANOVA with the right blocking factors, dose-response fits with appropriate weighting. The analysis matches the science.
Built for real-world science
Designed for the data you actually generate — uneven replicates, missing wells, mixed timepoints, controls that didn't behave — not the clean textbook datasets statistical tools usually assume. Get a sound analysis from imperfect data instead of a method that quietly fails on it.
Insights that adapt with your thinking
Start with "compare these conditions," then follow up with "what if I drop the outliers?". Each question re-runs in place against the same data and context, so you pressure-test findings the way you actually think — not by starting over with every cut.
Explore AI Data Analysis prompts

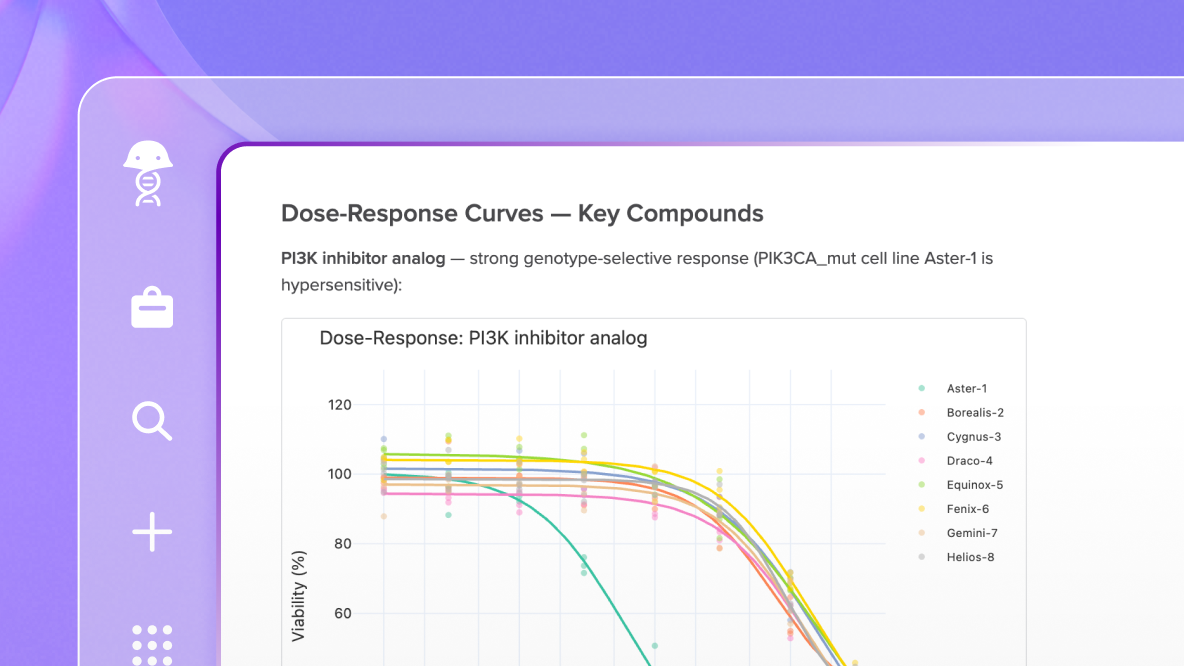
Statistical data analysis
Compare dose-response curves for these compounds. Show IC50s, means with error bars, and analyze variability.
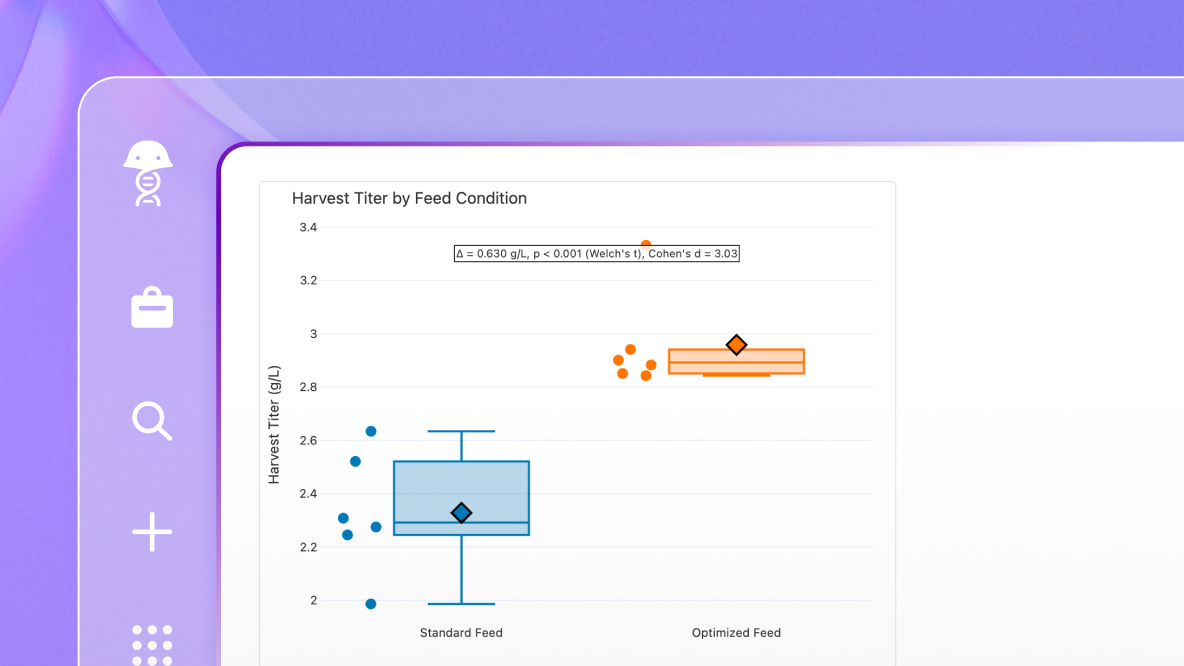
Bioprocess data analysis
Which bioprocess parameter drives the biggest increase in titer?
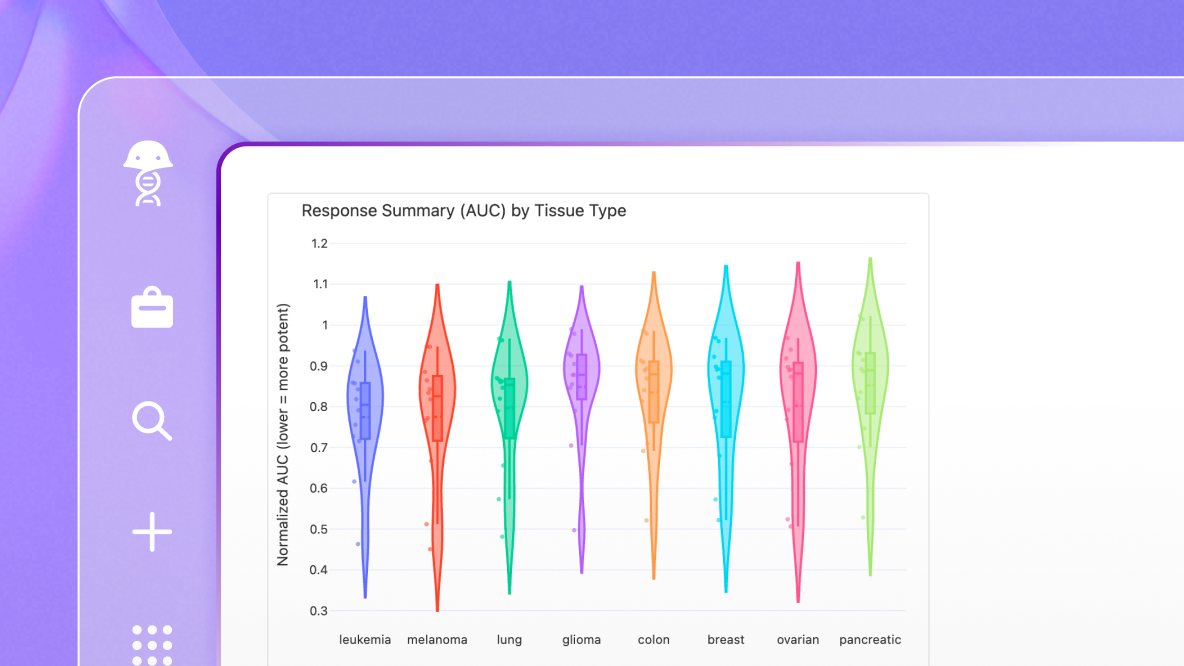
In vivo data analysis
Summarize tumor response across tissue types, after normalizing AUC distributions per tissue.
Learn how teams are using AI