Create and reproduce analyses faster with no-code data transformation and charting tools

Say you’re starting a cell viability analysis. So you search and find the original data generated by the cell therapy R&D team a few weeks ago. You copy and paste the rows you need into a new spreadsheet (or JMP) to get started.
This common analysis workflow task, copy-and-pasting, is risky. The smallest error or omission can throw off your whole analysis. At the best, it’s a waste of time. At the worst, it results in an incorrect analysis that causes downstream effects, like IND filing inquiries into the data error.
The best way to remove the risk of tasks like manual copy-and-pasting and time-consuming data wrangling? Automatically importing and aggregating data for analysis.
That’s exactly what you can do in Benchling, and best of all, there’s no code required. Using our data transformation and charting tools, you can join, query, and aggregate data from Benchling and other systems to create datasets and visualize them. You can import CSV files, and each dataset is stored as an immutable or locked object to preserve its lineage. Here we’ll explore how you can move from manual, error-prone workflows to more automated, high-quality datasets with Benchling’s analysis tools.
1. Analyze datasets from multiple sources
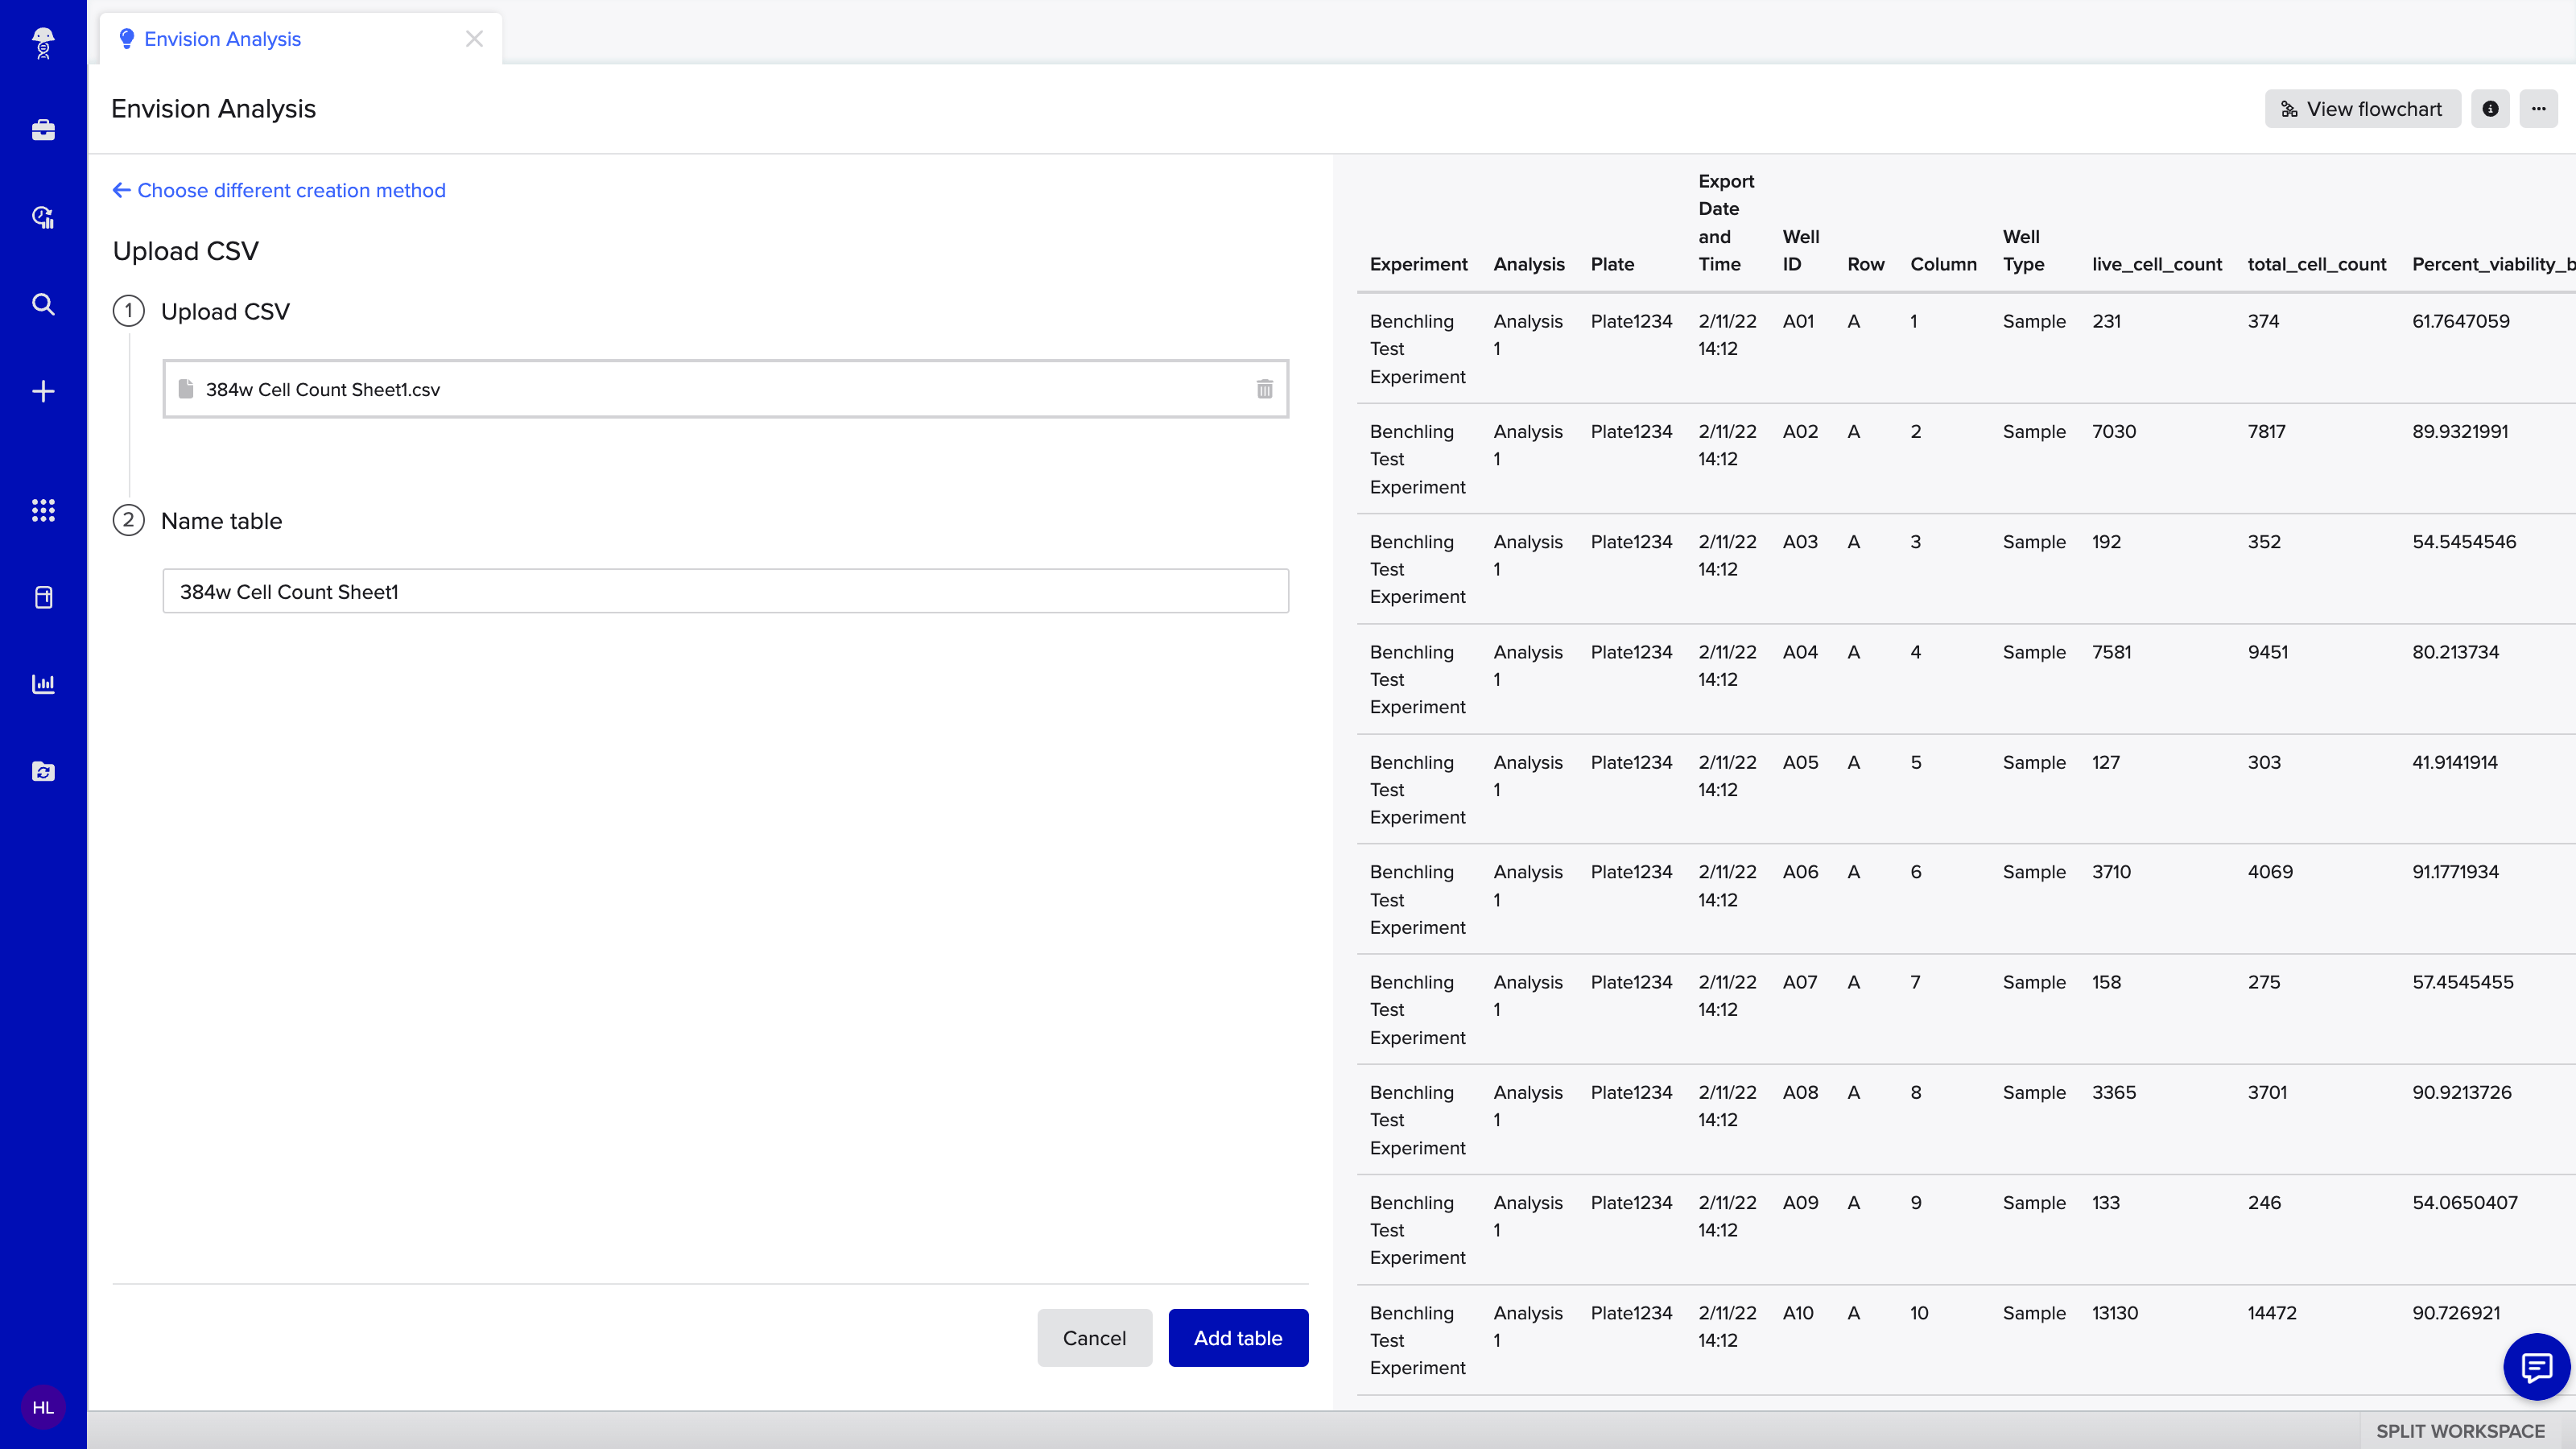
Benchling allows you to create no-code datasets with an intuitive point-and-click experience — and now you can pull in datasets from multiple sources for your analysis. You can analyze any structured data from a notebook entry, ingested via a run, or from an existing SQL dashboard. You can even upload your own CSVs, as pictured above.
2. Transform your data into an analysis-ready format
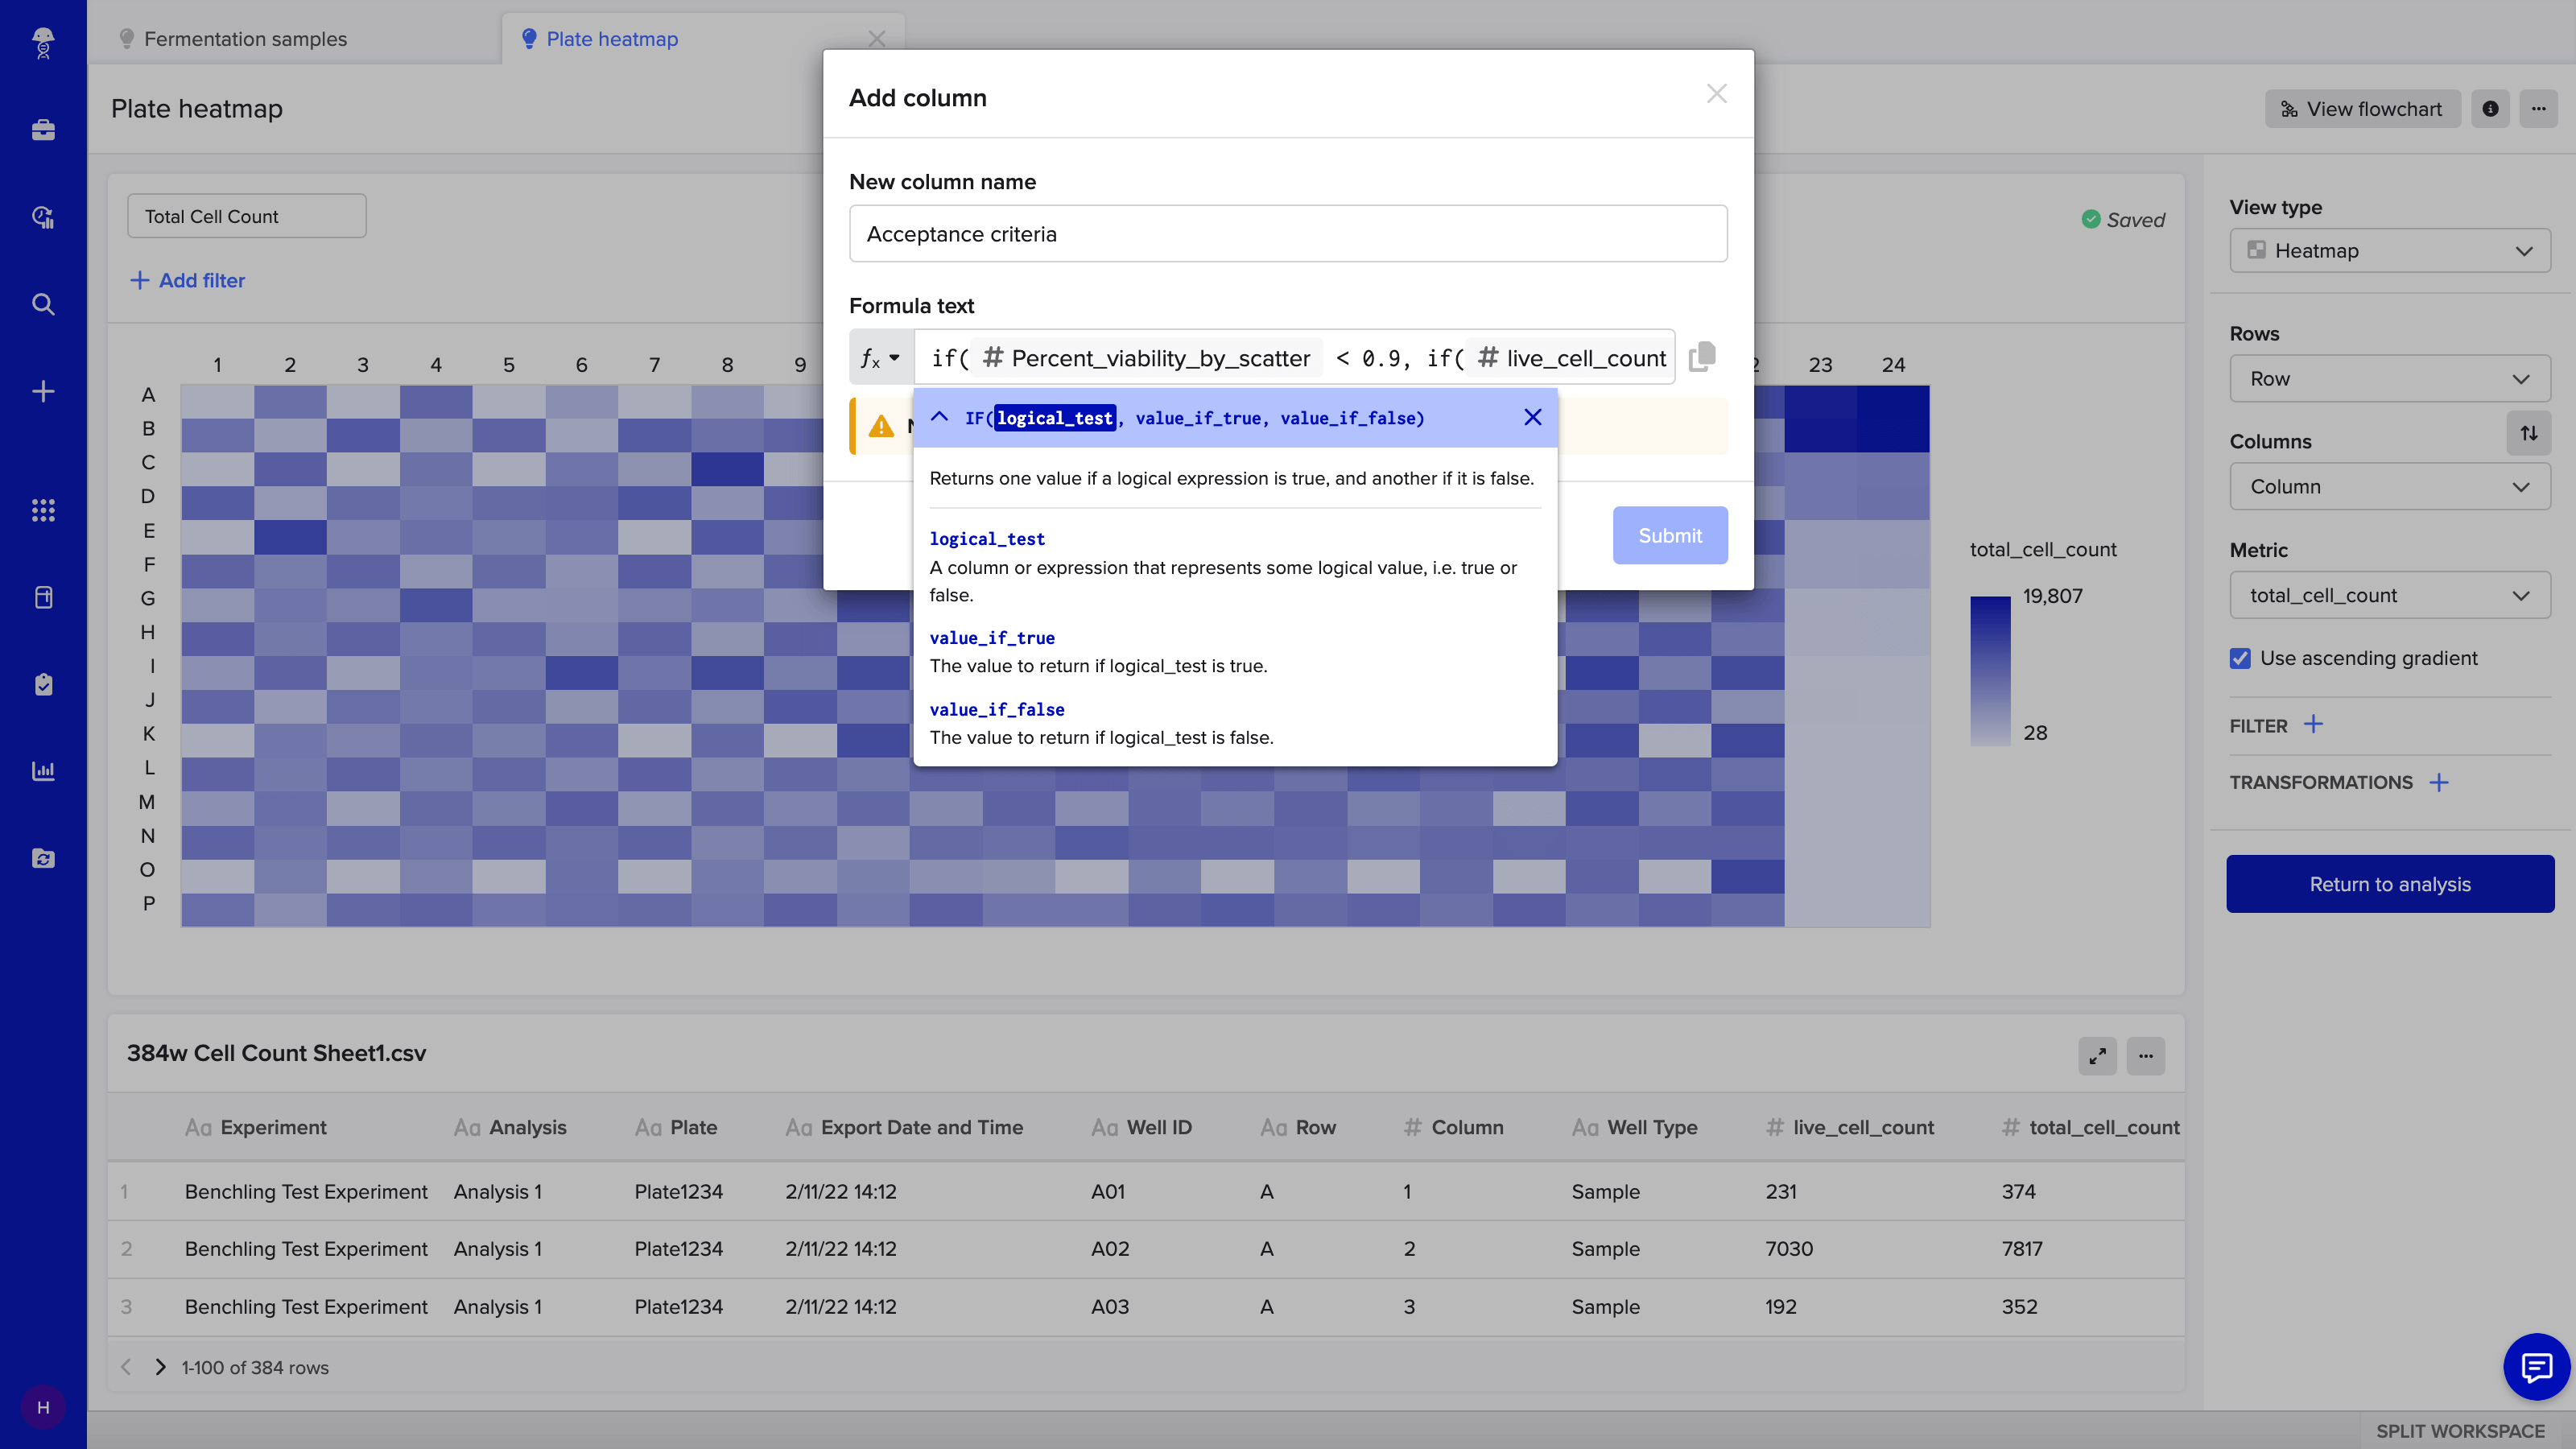
Once data is brought in, you can transform it into an analysis-ready format in minutes with native tools. Any scientist can become a data munger. For example, you can add a column that applies acceptance criteria using an IF statement for a plate heatmap of live cell counts.
3. Quickly visualize your data to identify and explore trends
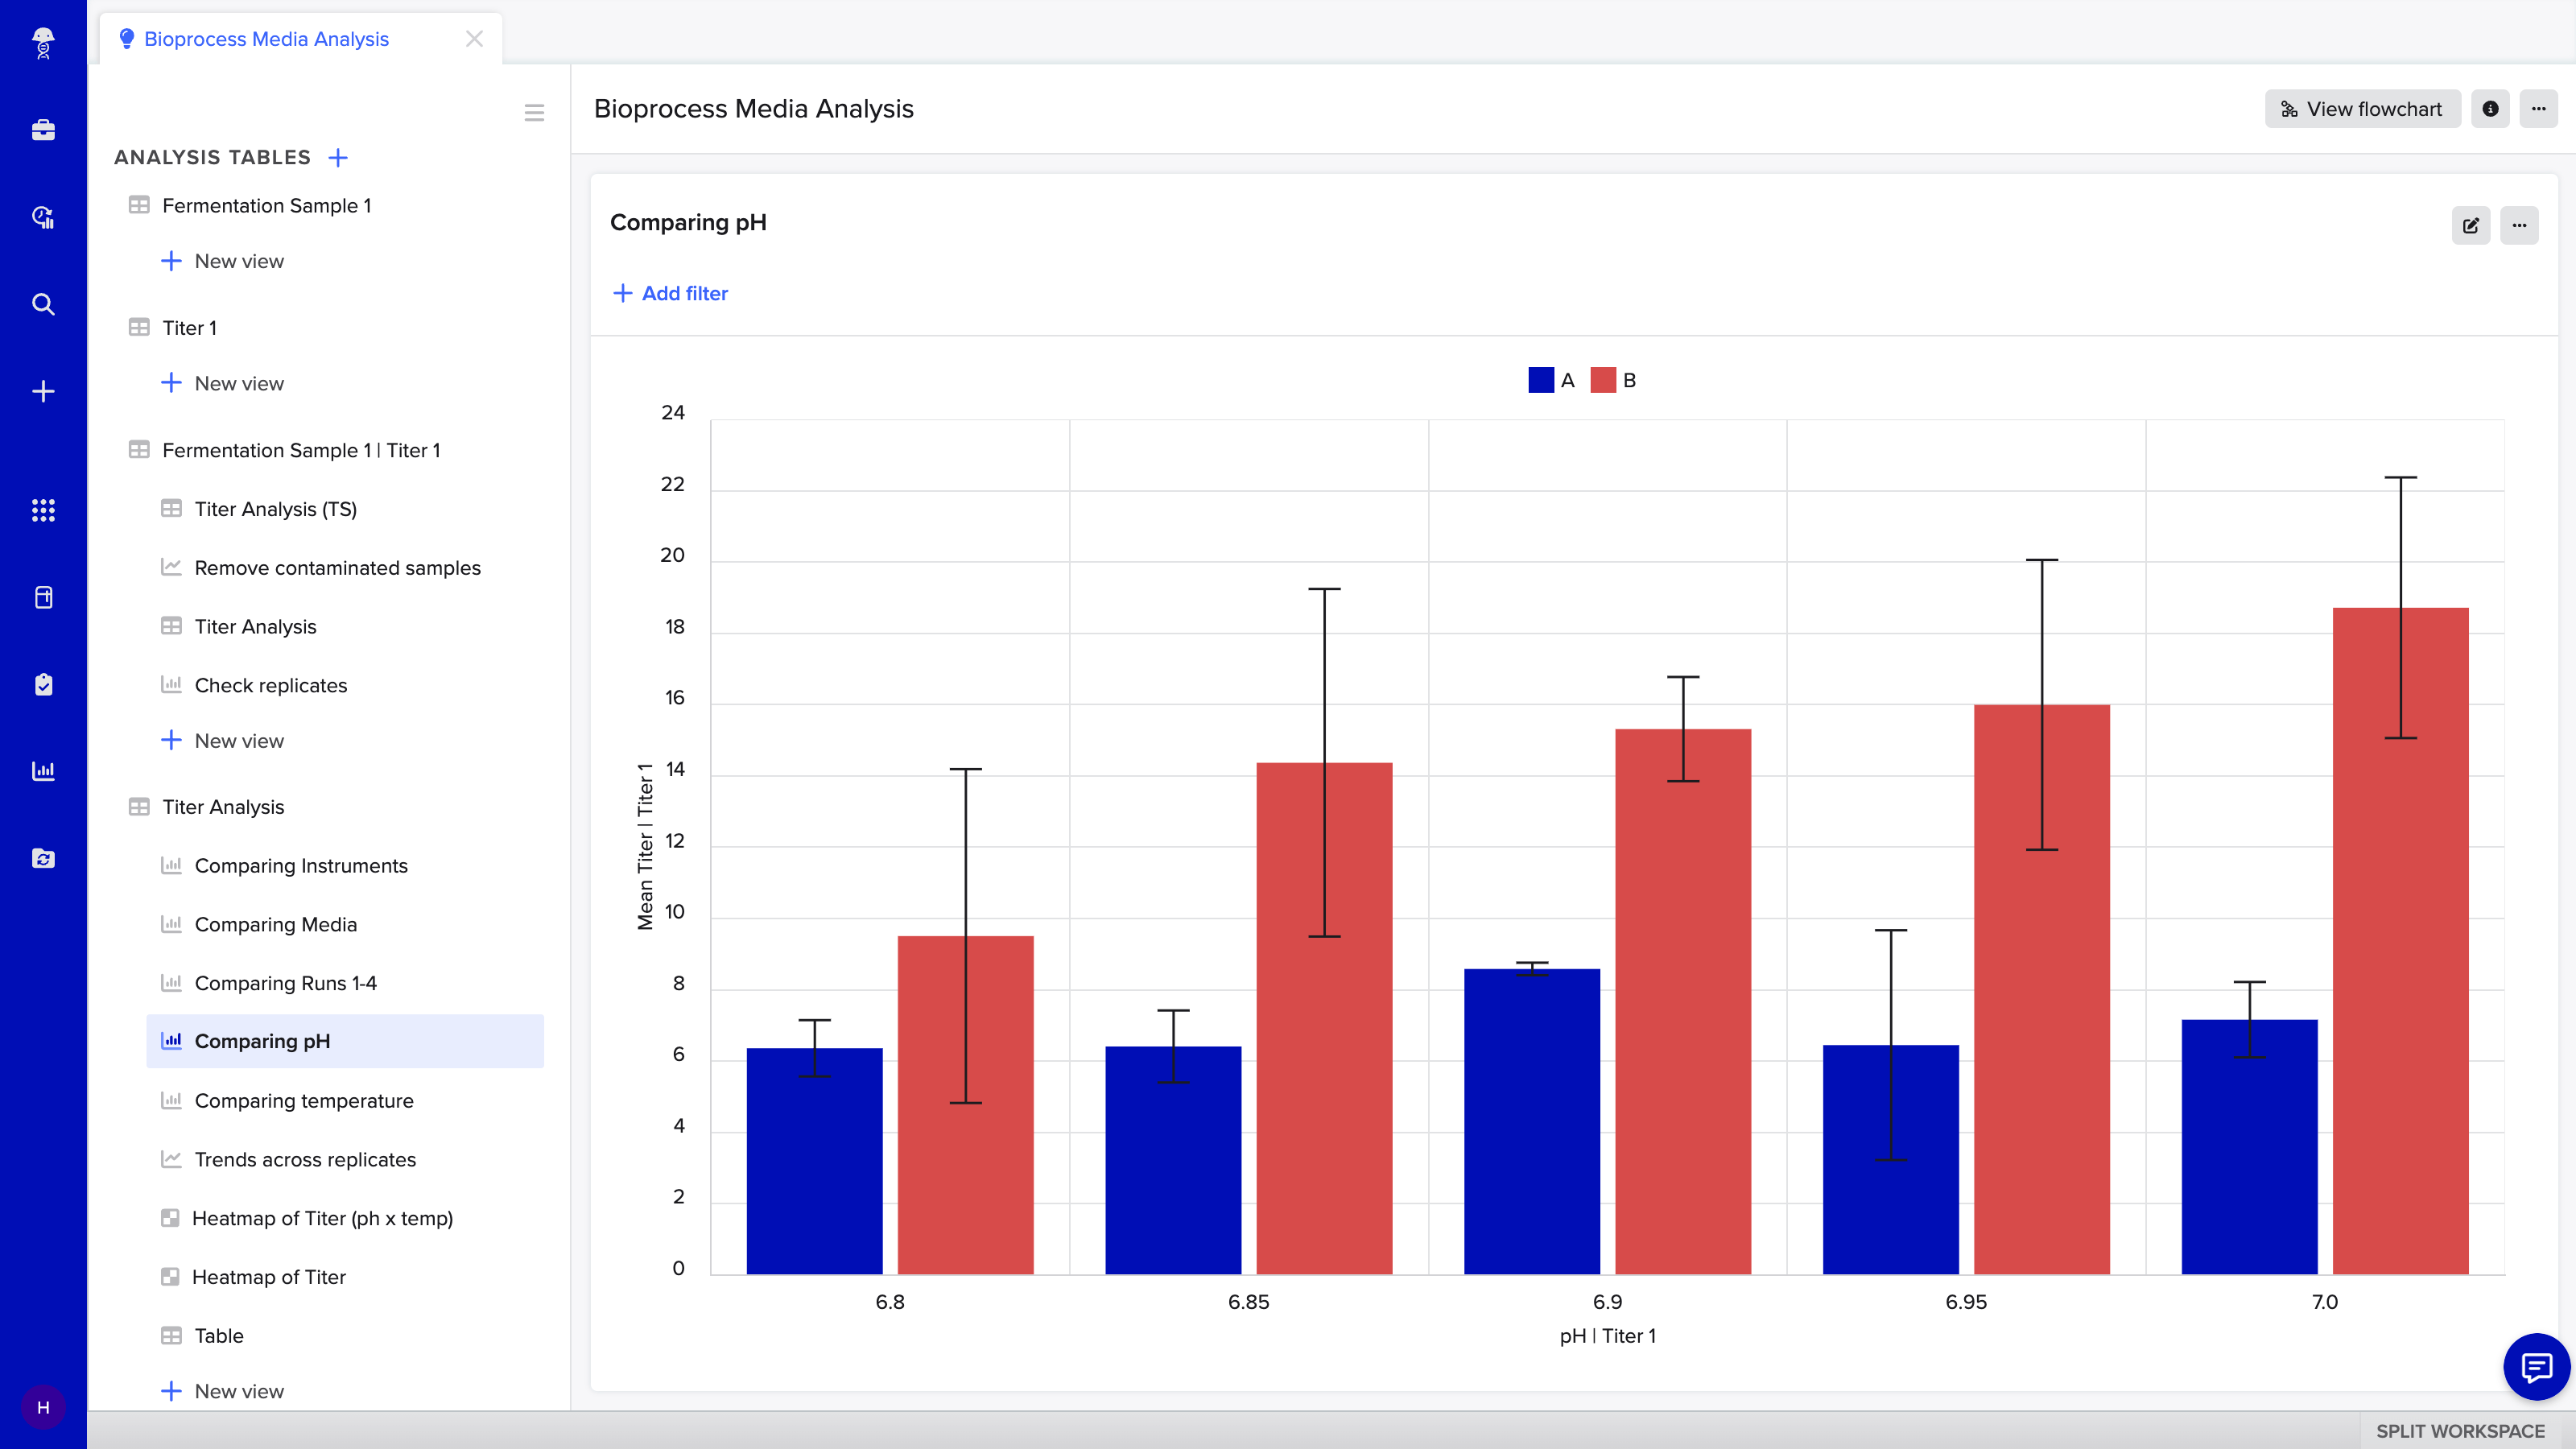
Data is only as useful as the insights you can glean from it. With these data transformations applied, you can visualize your data as a bar, heatmap, line, pie, or scatter chart with a few clicks. This enables you to quickly flag interesting trends in your data, like comparing the mean titer between two fermentation samples.
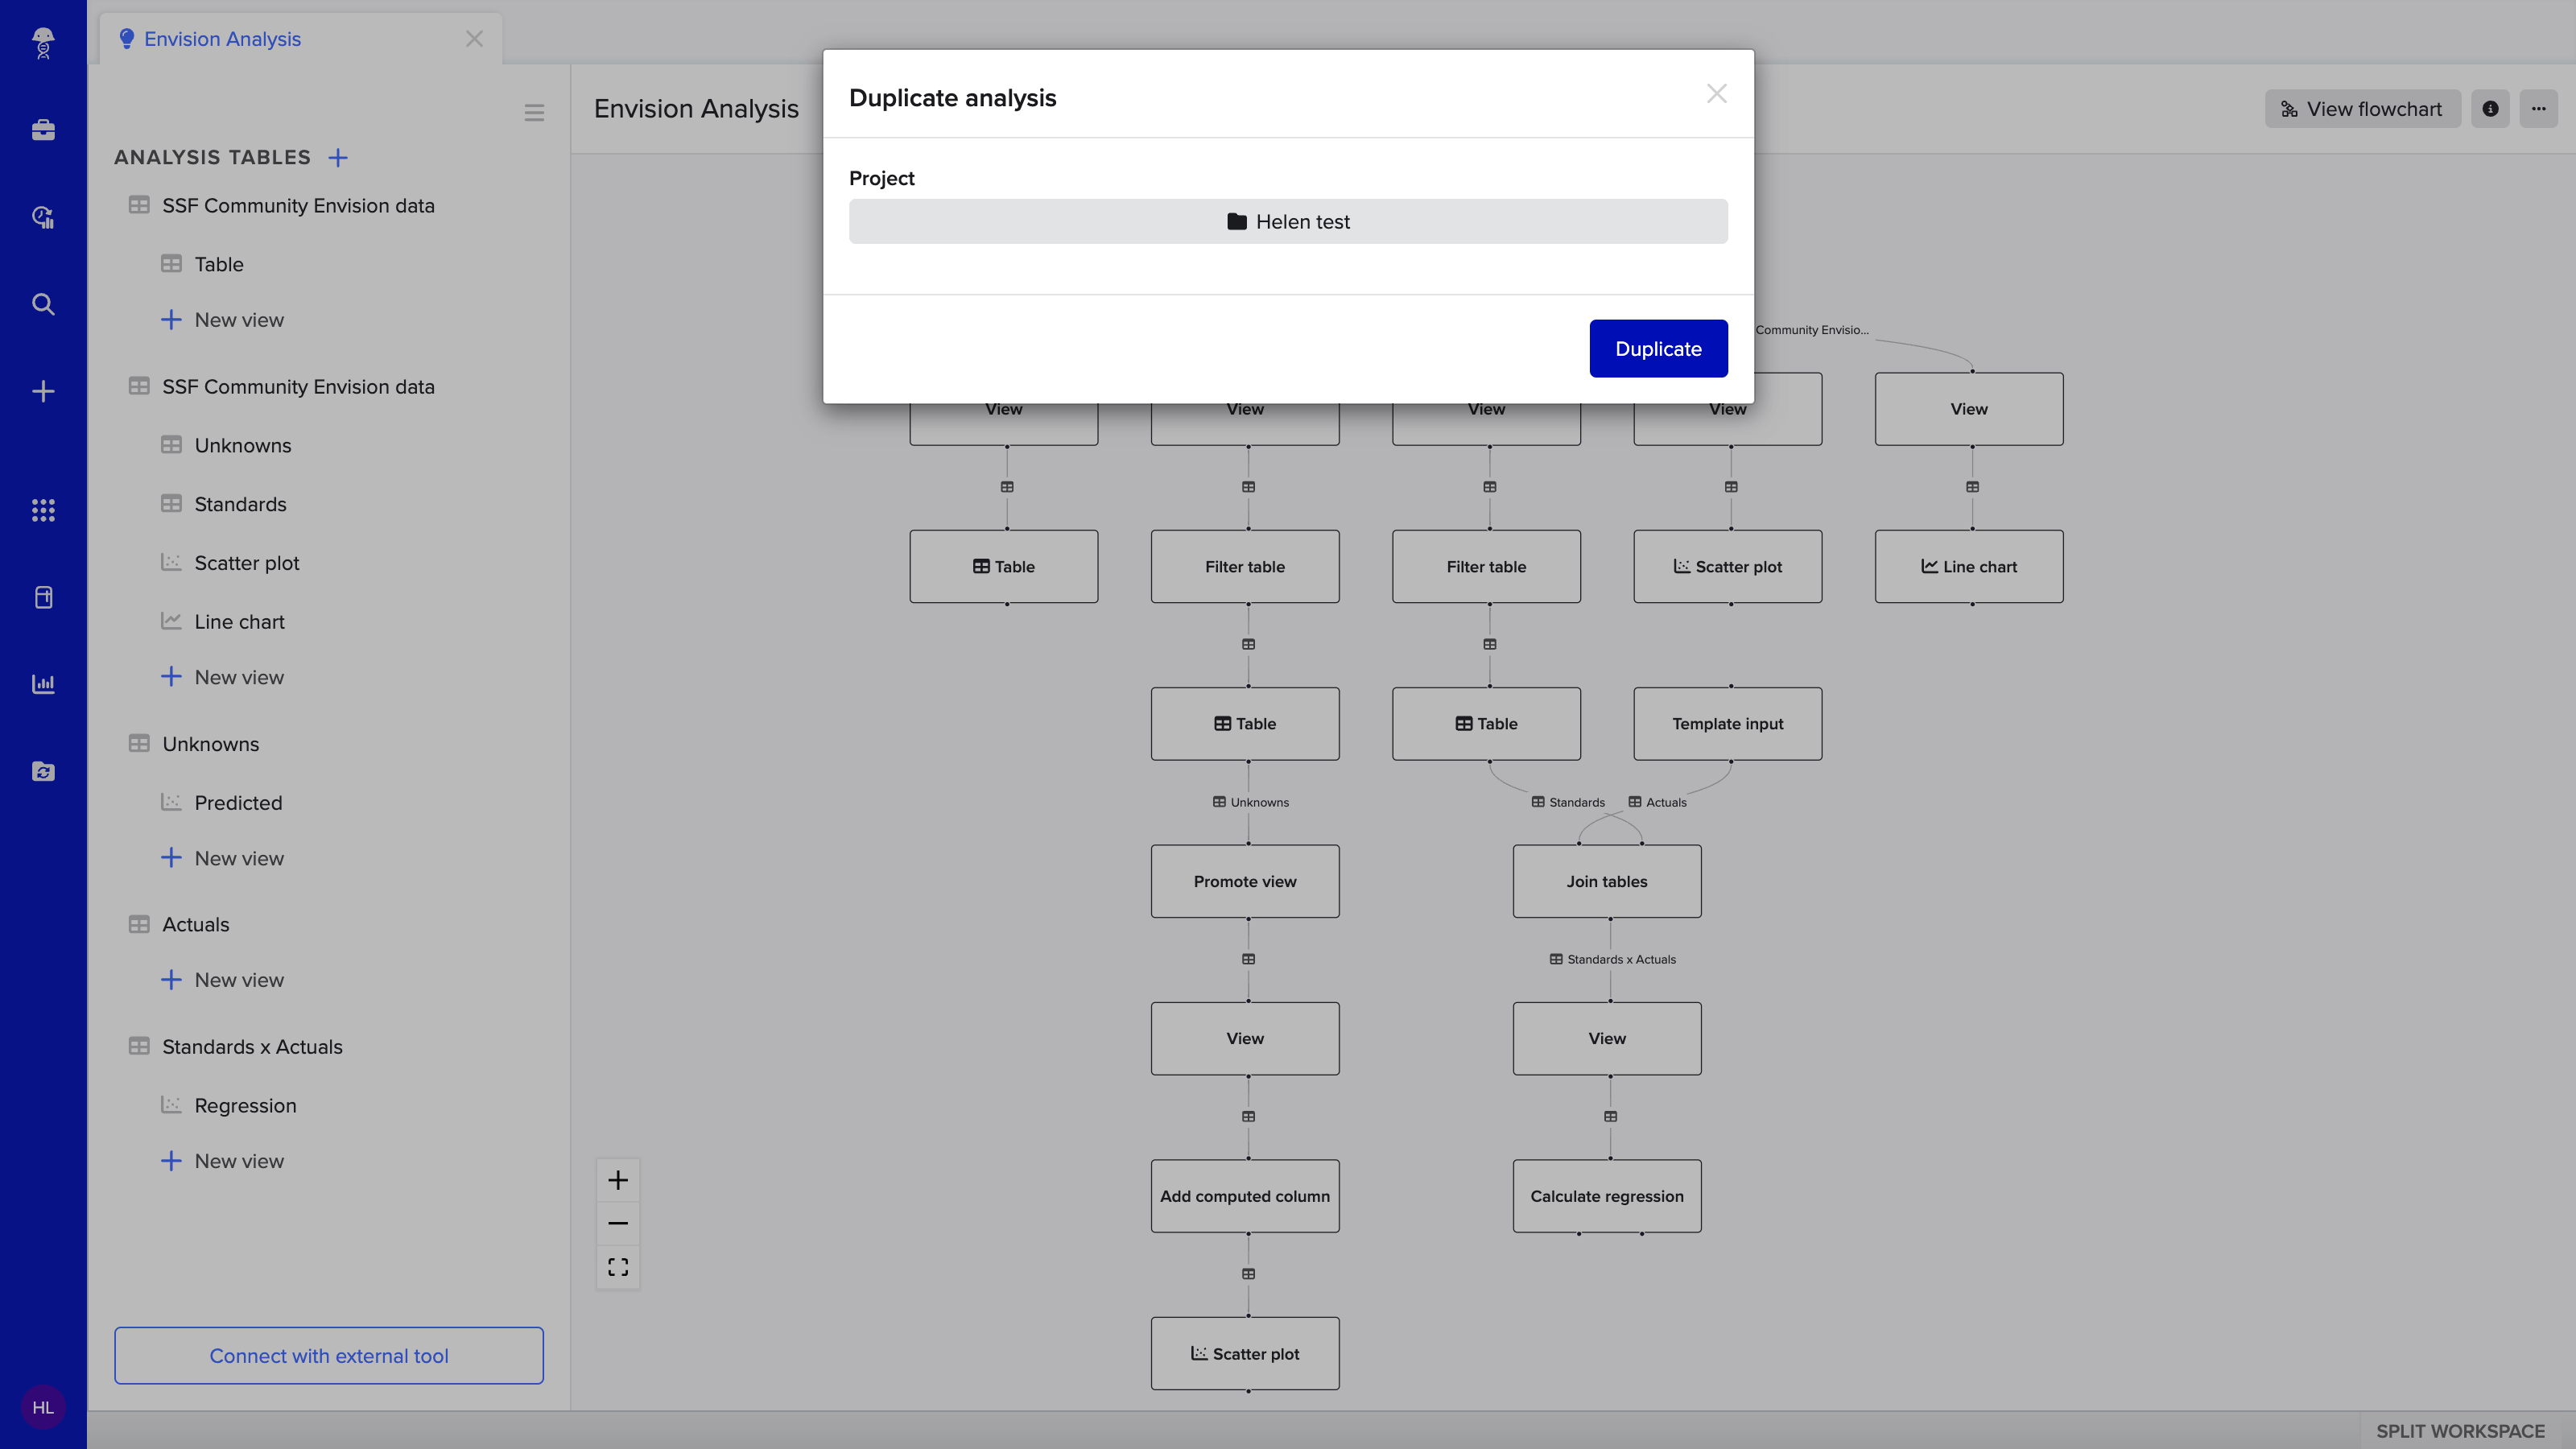
4. Track your analysis steps
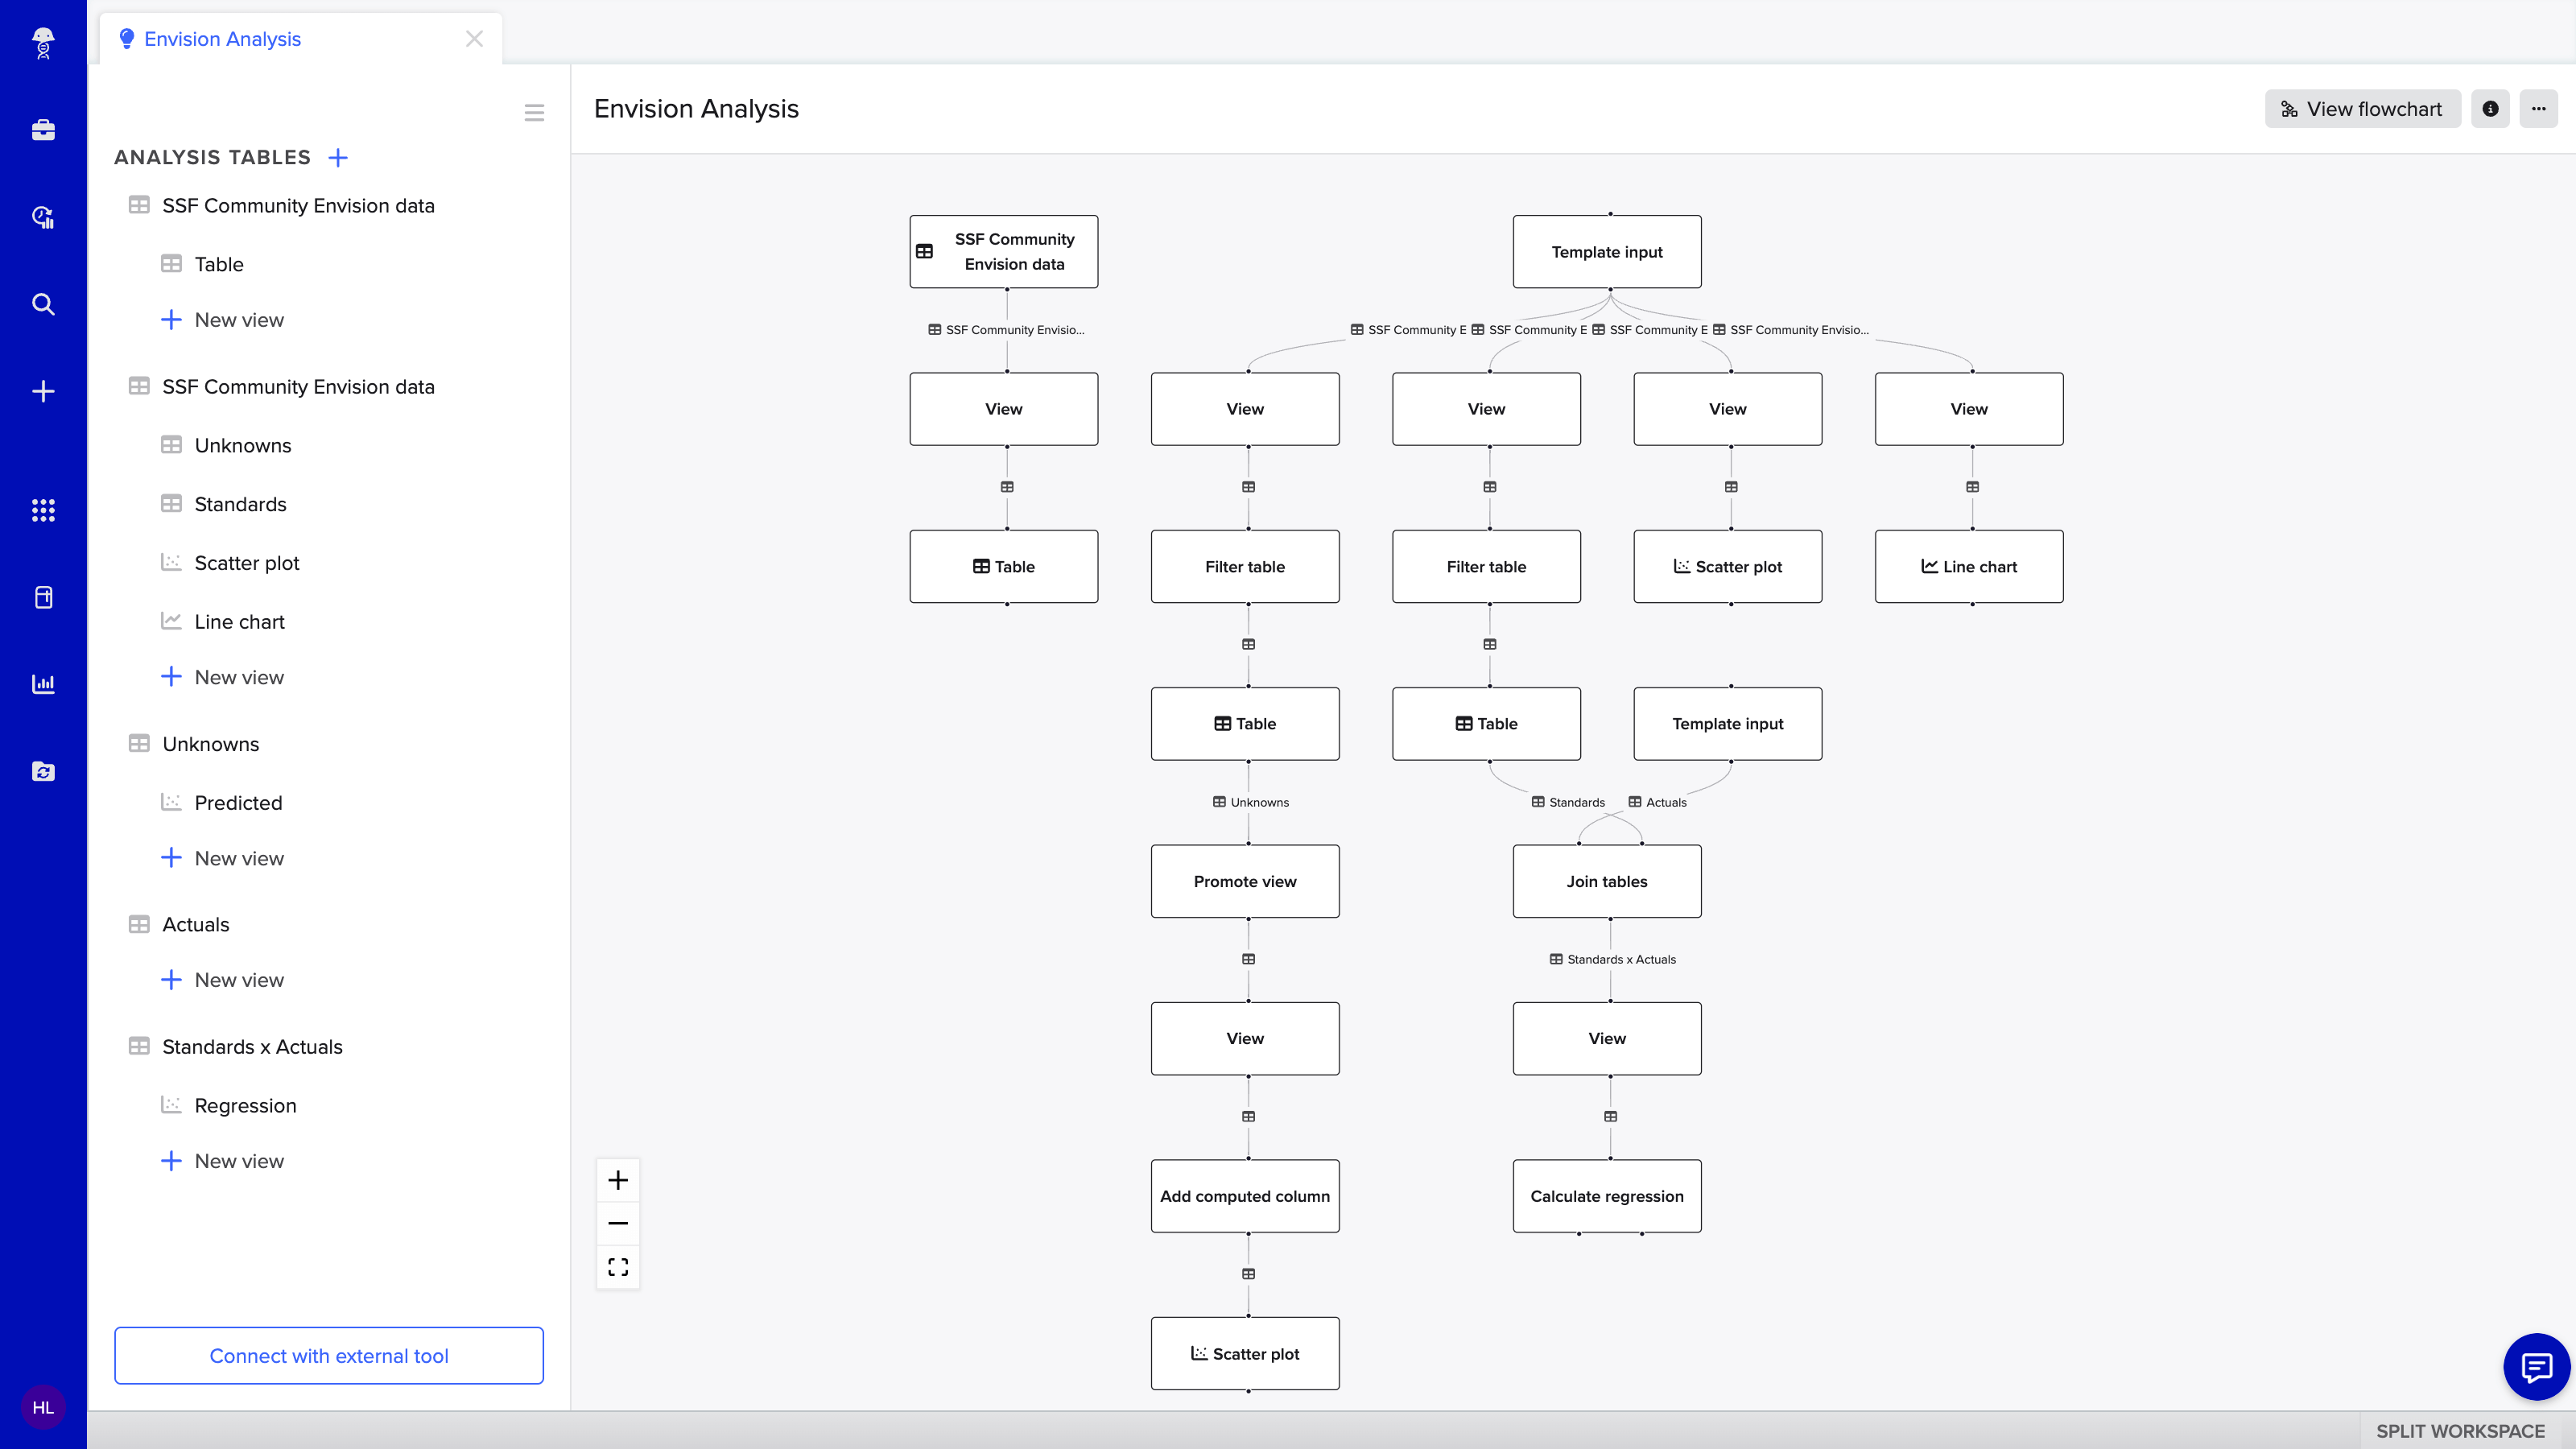
When you’re collaborating with colleagues or verifying your data, tracking your work is critical. With these features, you can retrace your steps for any analysis directly in Benchling, without losing track of your data sources or how you got to your conclusion. Benchling generates an intuitive flowchart view of the transformation and/or visualization steps you’ve taken.
You can also “@ mention” this analysis directly in a notebook entry to tie your conclusions to the source.
5. Reproduce your analysis
Reproducing analyses shouldn’t be a time-consuming endeavor. In Benchling, you can copy an analysis and replace it with new assay data from future experimental runs. Being able to reproduce your work allows you to maintain the quality and consistency of your analysis, methods, and findings. You can also easily collaborate with your colleagues and share analyses that have worked well for your team.
Want to start using these no-code data transformation and charting tools?
All customers have access to this open beta feature, but you’ll need to have Benchling Insights turned on. Contact Customer Success or support@benchling.com to get access today.
You can also check out our What’s New webinar to see a demo of our native analysis features in action.
