5 steps for implementing a new data model in life sciences R&D

Summary: Without a structured data model, the growing volume of life sciences R&D data becomes harder to manage and use. This post covers a five-step framework for getting it right.
Stakeholder alignment and a shared vision have to come before any technical work
Strong data governance means a dedicated council with clear policies around standardization, access, and accountability
Implementation runs through design, build, and test phases, ending with user acceptance testing before rollout
Every life sciences R&D company should be rethinking their data strategy to meet the new pace of research and development. At Benchling, we’ve worked with hundreds of life sciences companies who have evolved their data models as they’ve adopted Benchling. Read our team’s framework for building and implementing a data model successfully.
One of our customers at Benchling — a large biopharma creating cell and gene therapies — recently had a patient who wasn’t responding to their medicine in clinical trials. In just two weeks, they traced the patient’s therapy all the way back to the exact lab site it came from, where they realized a bad batch was created by accident.
Normally this issue could take weeks or months to diagnose. This team solved it quickly because they had a clear blueprint they could follow to trace the path of data in the organization. They had invested in Benchling as a data foundation, and alongside it, committed to building a data model that outlined exactly how data was organized, related, and stored across the organization.
This is just one example of why it’s mission critical for every life sciences R&D company to invest in structured and traceable data. At Benchling we’ve worked with hundreds of companies who have evolved their data models alongside their Benchling implementations. We’ve seen strategies that have worked and ones that haven’t. Here, we’ll walk through the framework we’ve compiled over time to understand a company’s ideal new data model and make it a reality across the organization. We hope this can be a useful guide whether you’re using Benchling or are just taking steps to modernize and future-proof your data strategy.
Why life sciences R&D companies are implementing new data models
Let’s discuss why many companies are choosing to undergo this type of project in the first place. There’s pressure from many angles; the first is an industry shift to biologics and advanced modalities — 60% of the drug pipeline now sits outside small molecules. Another is the widespread push to adopt AI/ML. Life sciences companies see the incredible opportunity to accelerate growth through AI/ML, so they’re racing to unlock this potential. This means structured data capture is now a strategic imperative. These are just a few, of many levers, leading to a massive growth in data generation in this industry — and this explosion of data requires organizations to rethink how they manage data at scale.
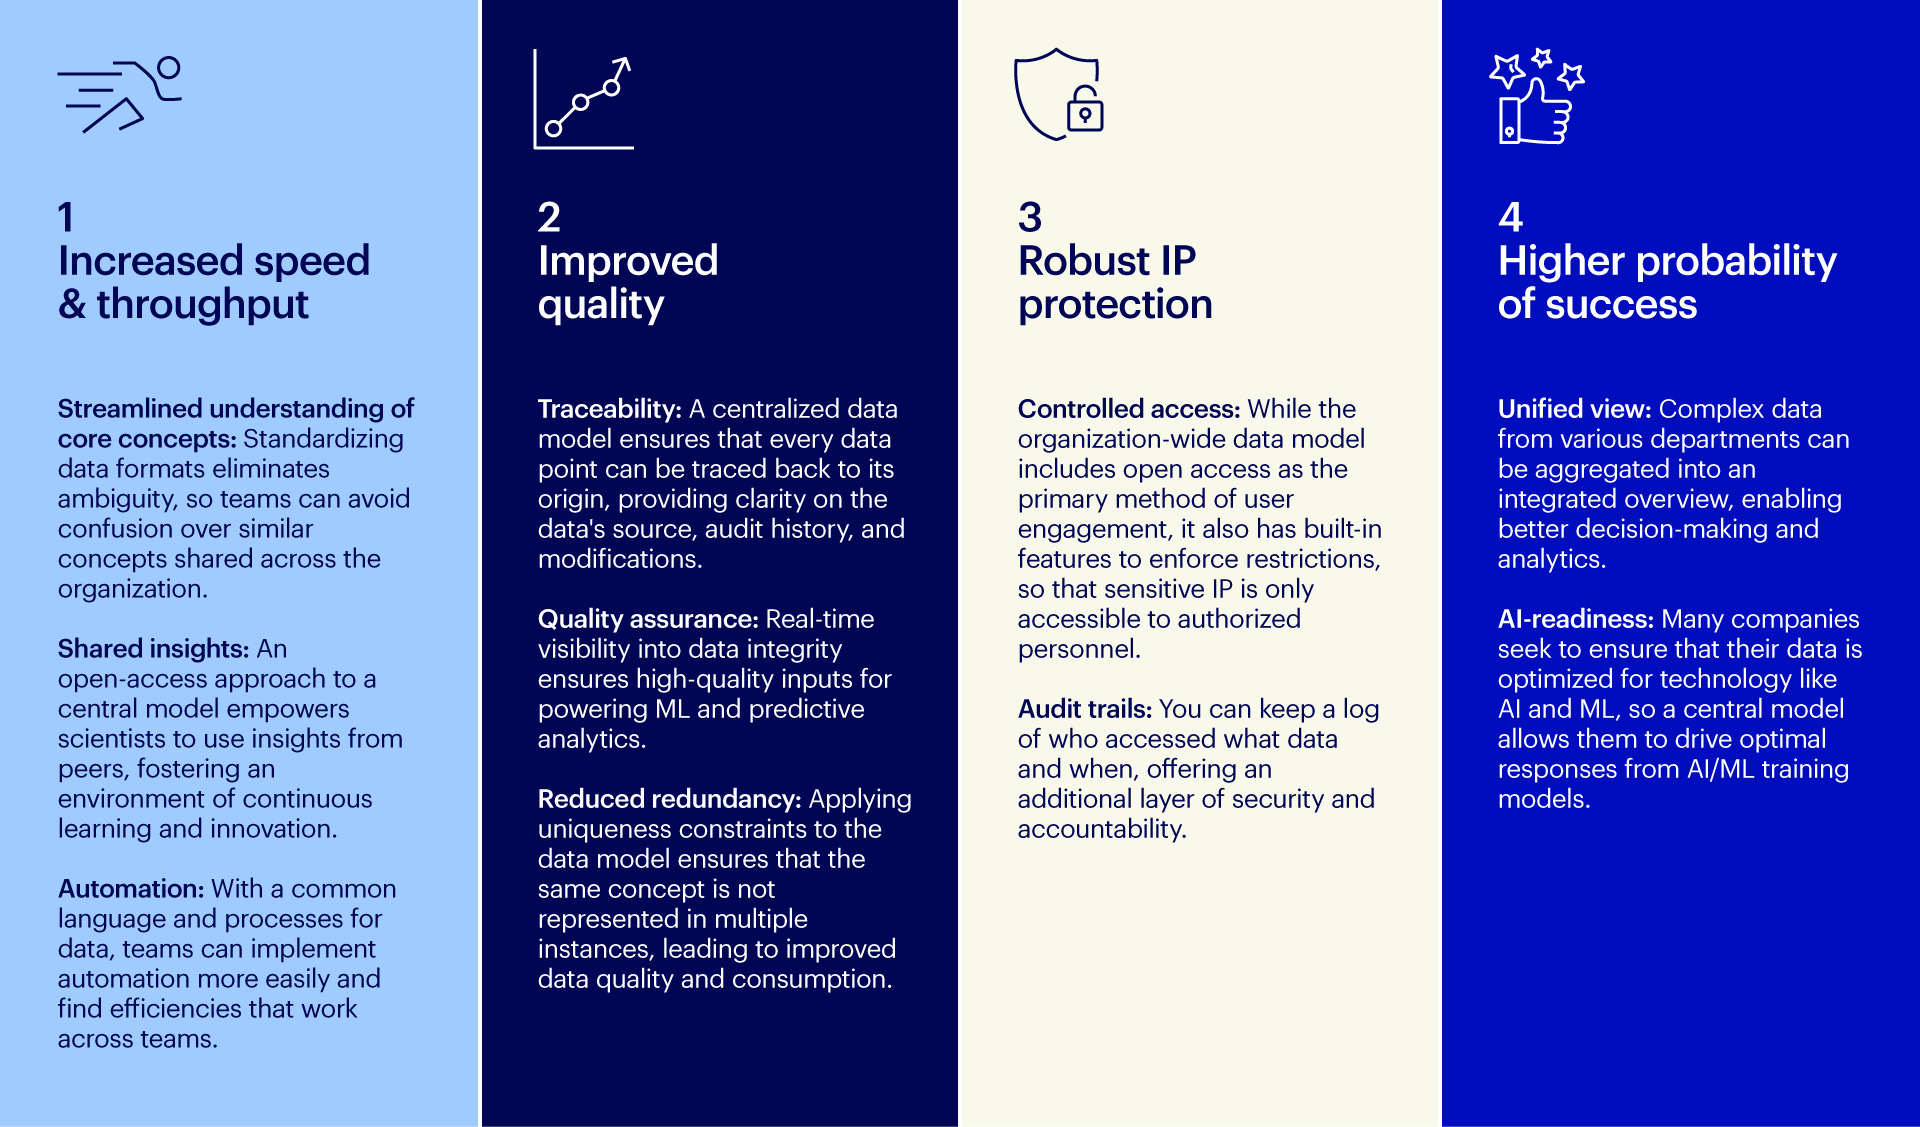
These are the main benefits we see companies look for when they move to Benchling and implement a new data model along with it:
Making your new data model a reality: The 5-step process
We recognize that changing your data model is a large, cross-functional effort. For life sciences companies in particular, it can fundamentally change the way your organization does R&D. At Benchling, we’ve used our experience in data model development across hundreds of implementations to build a refined, opinion-based approach to data modeling, allowing for relatively short development cycles. Instead of starting from scratch for each new project, we apply proven frameworks and best practices that anticipate common needs and challenges in life sciences data management. Since it’s built on industry-specific insights and is tailored for scientific data handling, we’ve found this approach consistently enhances the quality and reliability of the defined data model.
1. Establish a clear, shared vision
While it might seem obvious, starting with alignment on a future vision is a critical first step that’s often overlooked. The shared vision is the long term goal that defines what your organization is trying to achieve, and why — where you want to end up and the strategic context. This early stage is not just procedural; it sets the trajectory and potential success for the entire project. Without a shared vision, it will be difficult to unite stakeholders around the mission and gauge the success of your data model transformation.
There are two key actions that help define the vision: engaging executives to understand their expectations and anticipated return on investment, and gathering a diverse group of stakeholders across the organization. This group of stakeholders will be integral to the project’s success and should span the full scope of folks impacted or involved, including scientific R&D, IT, data management, data science, and external partners, as a few examples. Understanding the data needs of this group will help you develop success metrics for the project.
You can list out your vision as a series of action-oriented goals. Here’s an example list to help you get started:
Increase efficiency and/or throughput by consolidating several systems into one
Decrease time per phase to advance candidates through the pipeline
Share data more easily and securely across the organization
Speed up ramp time for onboarding new scientists
Improve collaboration between data management and scientific staff
Enable data-driven decisions through contextualized data capture
2. Planning
The planning phase is critical for successful data model development, which will require extensive coordination with stakeholders. The objective of this phase is to ensure alignment, clarity, and readiness across the organization’s stakeholders. Below, we'll break this phase into two buckets of activities: developing the project management foundations, and gathering requirements.
2a. Develop the project foundations
When starting any new project, it’s important to establish the structures and tools that will allow you to manage the execution of scoped work efficiently. This involves the creation of, and ongoing management of a: project plan, project knowledge base, RAID log, requirements tracker, status report, financial tracker or burndown report, and a RACI. These foundational tools will drive alignment across all project team members on the sequence of events and dependencies that inform how the project will be executed, roles and responsibilities, risks/issues, assumptions, decisions, progress against plan, and budget management.
2b. Gather requirements
At this point, the higher-level scope should be well understood. This is the point where you’ll need to more deeply understand what your organization aims to achieve with its data model. This involves collecting detailed requirements from various stakeholders, including scientific researchers and IT professionals. Identify both the known needs and the known unknowns — areas where the organization may lack clarity or face uncertainty. This could involve emerging technologies or anticipated regulatory changes that could impact data management. The idea is to strategically create a flexible design framework that can adapt to these unknowns, for example, incorporating modular design principles that allow for easy adjustments as new information becomes available.
Requirements gathering may involve joint training sessions on data management best practices or collaborative workshops where both scientific and IT personnel can explore and refine requirements together. It’s important to align on the appropriate level of detail for defining requirements, and a consistent format for documenting these requirements across the organization. An ‘information dump’ where too much information is shared, and/or in inconsistent formats, is a common pitfall in the requirements gathering phase. Take care to avoid this risk.
Translating requirements into a business process map is an essential step in developing a data model, as it provides a visual representation of the desired system and ensures that all stakeholder needs are addressed. Below, we share more on the stages involved in creating and using business process maps effectively.
Developing business process maps
Business process maps are a tool used to visually depict the steps, inputs, outputs, and flows of processes within an organization. In the context of data model development, these maps are particularly valuable, as they cleanly represent how data should be handled and processed to support scientific use cases. It’s important to document both current state, inclusive of known pain points, and, where known, future-state business processes.This helps ensure that your future data model can support existing operations, while also accommodating future organizational R&D changes.
Identifying key processes: Begin by identifying the core processes that are crucial to your organization’s scientific work. This might include experimental planning, execution, data collection, analysis, reporting, and compliance checks. Each process is a candidate for mapping and requires detailed analysis.
Defining process boundaries: Define where each process starts and ends. This helps in understanding the scope of the data model and ensures that all necessary steps are included in the map.
Documenting business process maps
The outcomes of process mapping sessions need to be cleanly, yet meticulously, documented. You’ll use this documentation as a crucial deliverable for multiple purposes later in the project.
Creating detailed process documents: Document each mapped process with a consistent, agreed-upon level of detail. This includes the roles of different stakeholders, the tools used at each step, and the data inputs/outputs. These documents should also include any assumptions made during the mapping and potential areas for data integration.
Version control and updates: As processes evolve, or as new requirements emerge, you may need to update business process maps. Maintaining version control and recording changes is crucial to keeping all stakeholders aligned with the latest process flows and maintaining an ‘audit trail’ around changes.
Developing reference material for design and implementation: These process maps and their accompanying documents serve as reference material during the design and implementation phases of data model creation. They ensure that the system you develop accurately reflects your organization’s operational needs and supports your scientific endeavors.
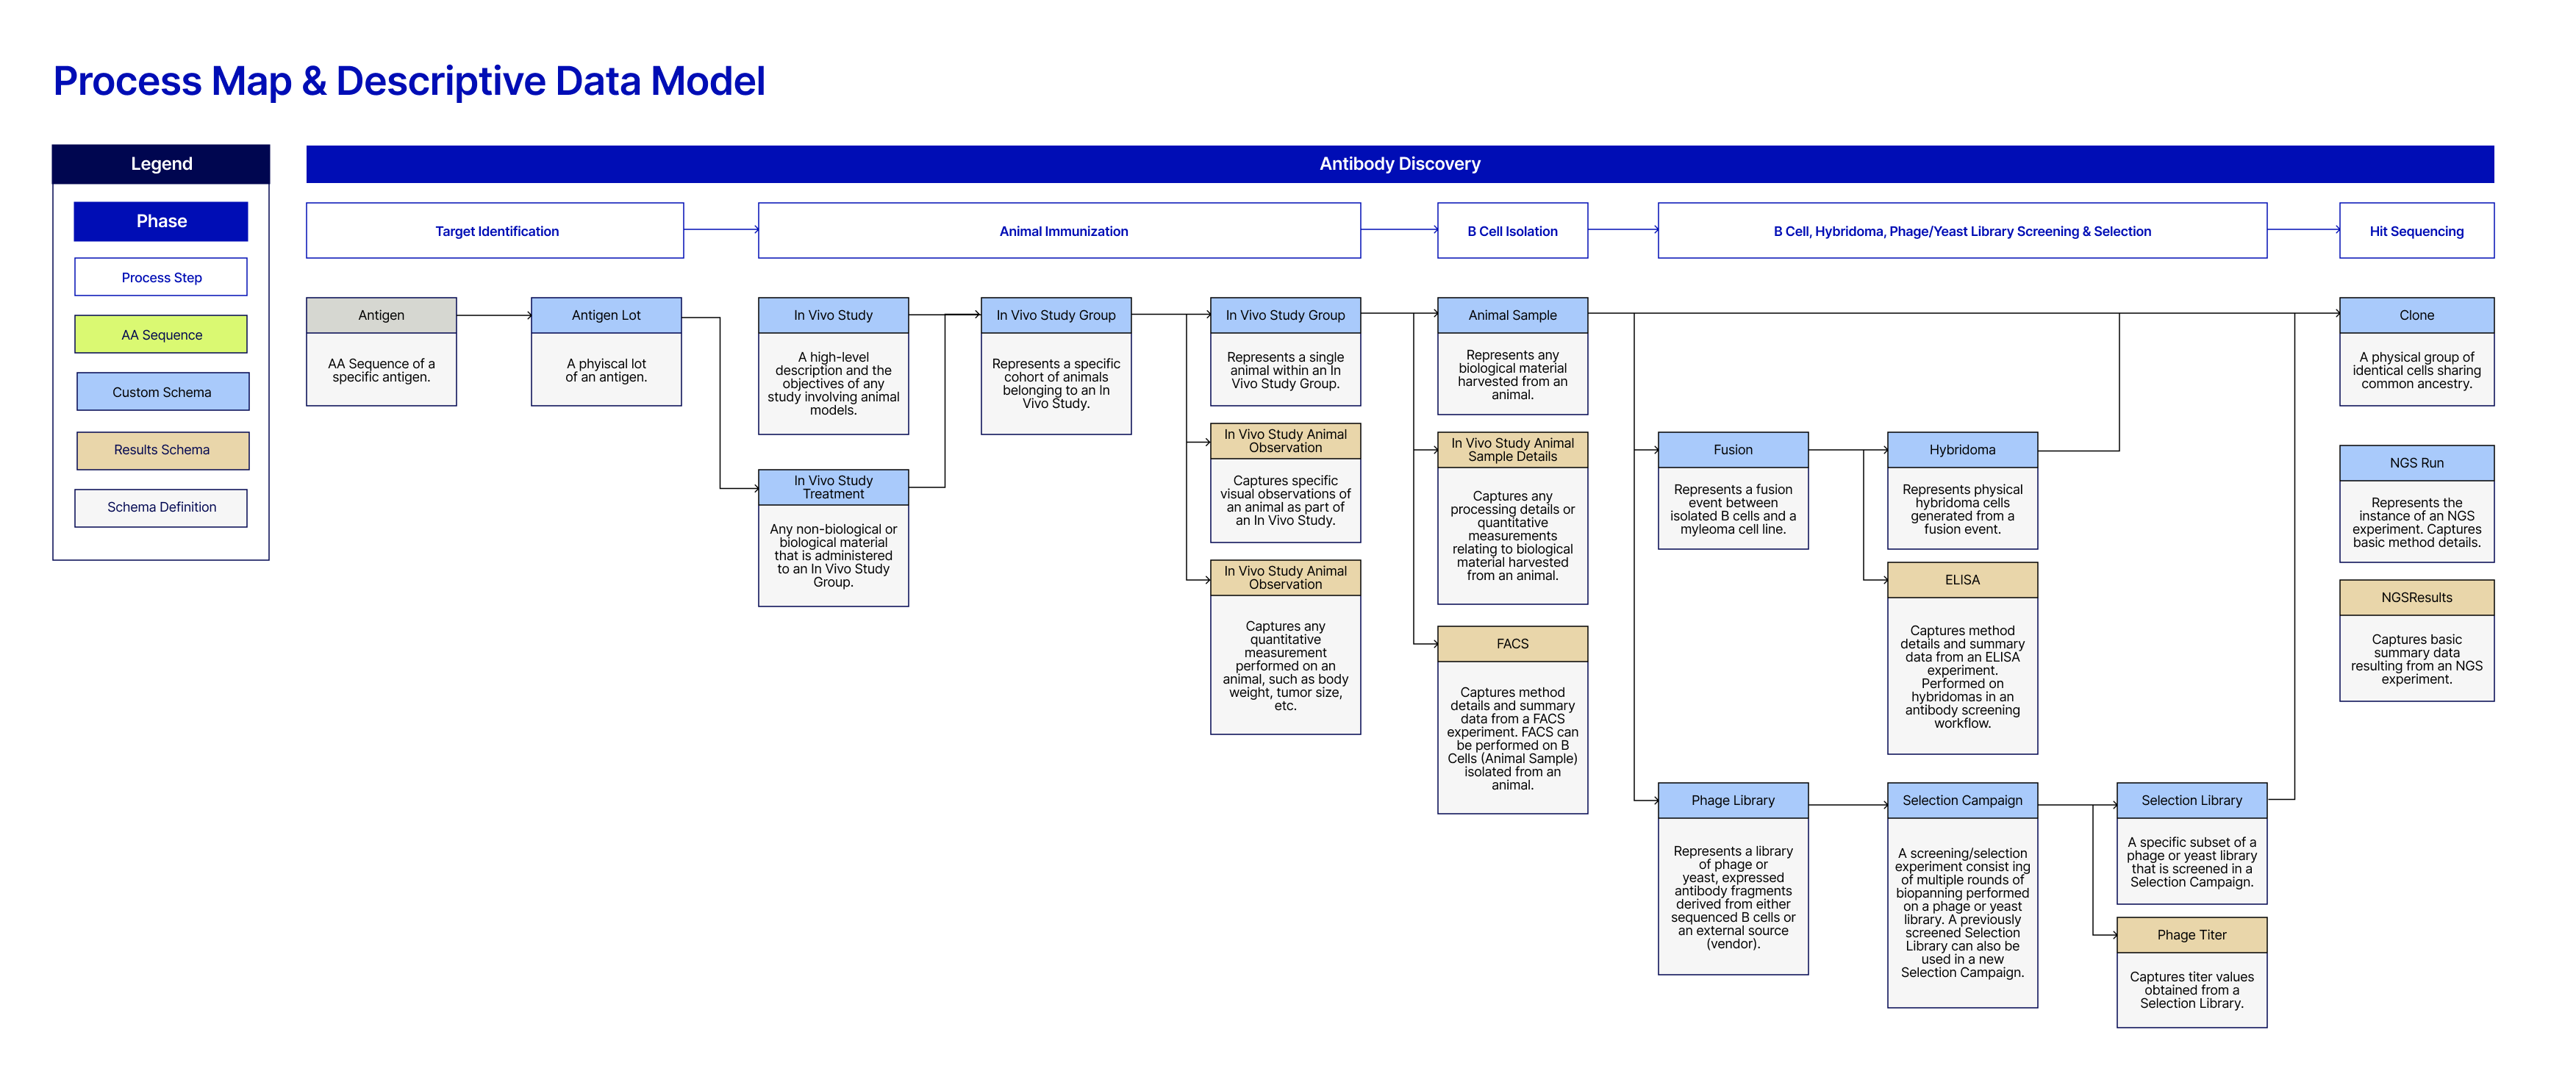
Below you can see an example of a process map and descriptive data model, created specifically for antibody and protein research. Note that this is simplified and shows one part of the broader map.
Investing in upfront planning and requirements gathering allows you to establish a strong foundation for designing a fit-for-purpose data model.
3. Establish your data governance framework
Establishing a strong data governance structure is crucial. A proven process involves forming a council and creating a comprehensive framework that guides all relevant decision-making around your data model. This process begins early in data model development and continues throughout its lifecycle, so that it’s aligned with immediate and long-term business objectives.
3a. Assemble a data governance council
Creating a data governance council provides clarity and oversight, determining who should be involved in decisions about data over time. It typically includes key roles such as senior IT leaders, data owners, and business unit heads. Below is an example of what your data governance council might look like.
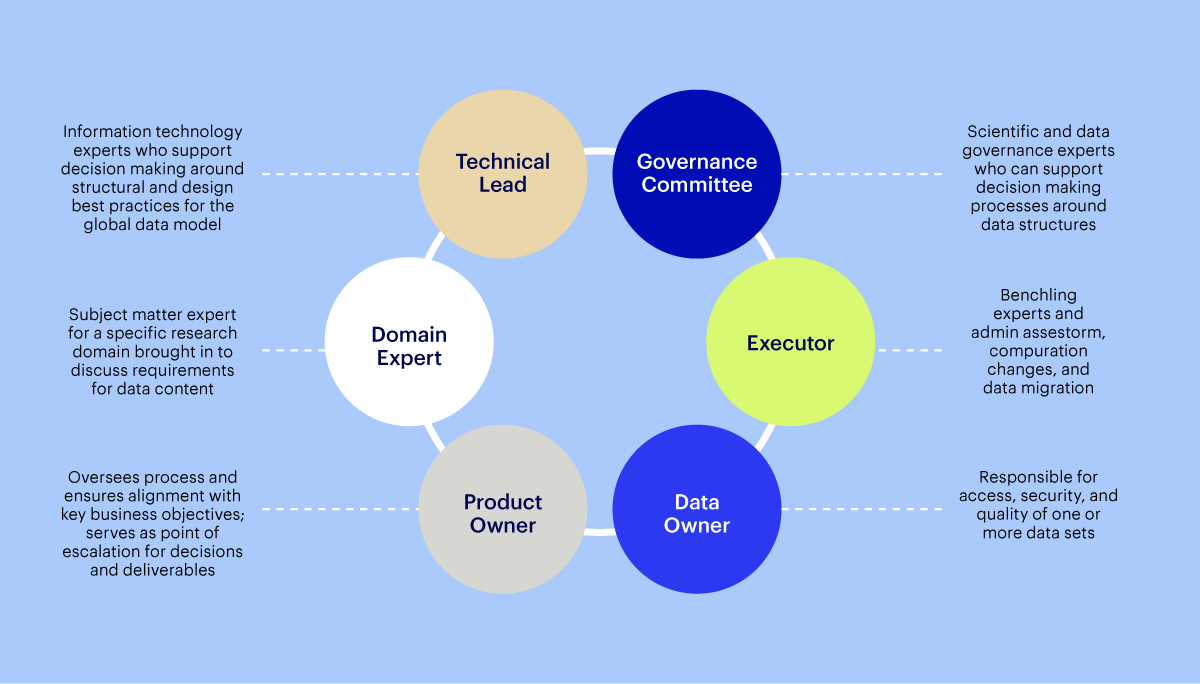
Council formation is split into two phases: initiation and maintenance. The initiation phase focuses on establishing the foundational governance structures and principles needed to support your new data model. During this phase, the council should meet frequently to establish the groundwork and set your organization’s strategic direction for data management.
Once your foundational elements are in place, the council transitions into the maintenance phase. This stage centers on executing against the established practices, and adapting them to accommodate changes in the business and technological landscapes. The council should decide on a meeting cadence that balances the need for regular oversight with the practicalities of their schedules, so that governance practices are consistently applied and stay relevant. Try a monthly or bi-weekly cadence as a start.
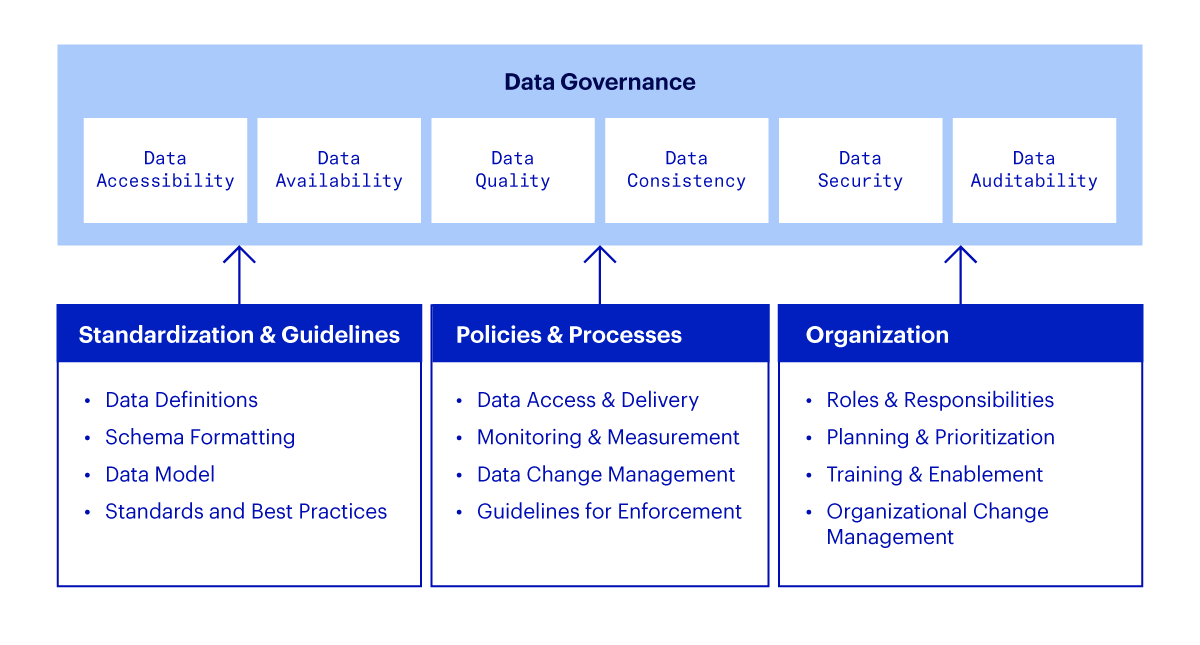
3b. Build the data governance framework
The council should build a data governance framework for your company — a set of guiding principles that span three major areas: standardization and guidelines, policies and processes, and organization. These principles aim to maintain data quality, enable you to use disparate data sources, and ensure scalability of teams and processes over time using the new data model.
Standardization and guidelines: These ensure that data handling across the organization follows a consistent approach, which is essential for maintaining data integrity and reliability.
Policies and processes: These define how data should be managed and used, setting clear parameters for data access, sharing, and security. This includes data privacy policies, user access controls, and data usage policies.
Organization: This structure outlines the roles and responsibilities related to data governance, ensuring clear accountability and lines of communication. It helps define who is responsible for making decisions on what aspects of data, and minimizes gaps in data management.
4. Implement your solution
The implementation phase is the longest part of the project. Depending on the size of your organization and scope of data model development, it can take weeks, or even months, to develop an initial model. The implementation process is broken down into design, build, and test sub-phases below.
4a. Design
The design phase is where you translate functional business requirements into technical specifications that will dictate how data is stored, managed, and used.
The initial step in the design phase involves meticulously analyzing and translating business requirements into data types, structures, and constraints. These requirements are often complex, involving diverse data types, such as genomic sequences, fermentation parameters, and assay outputs. The aim is to establish a clear and efficient structure for capturing, handling, and processing this data to support various scientific and business functions. More specifically, this involves identifying what data to capture, how it should be structured for efficient processing and retrieval, and any constraints that need to be applied for data integrity and security.
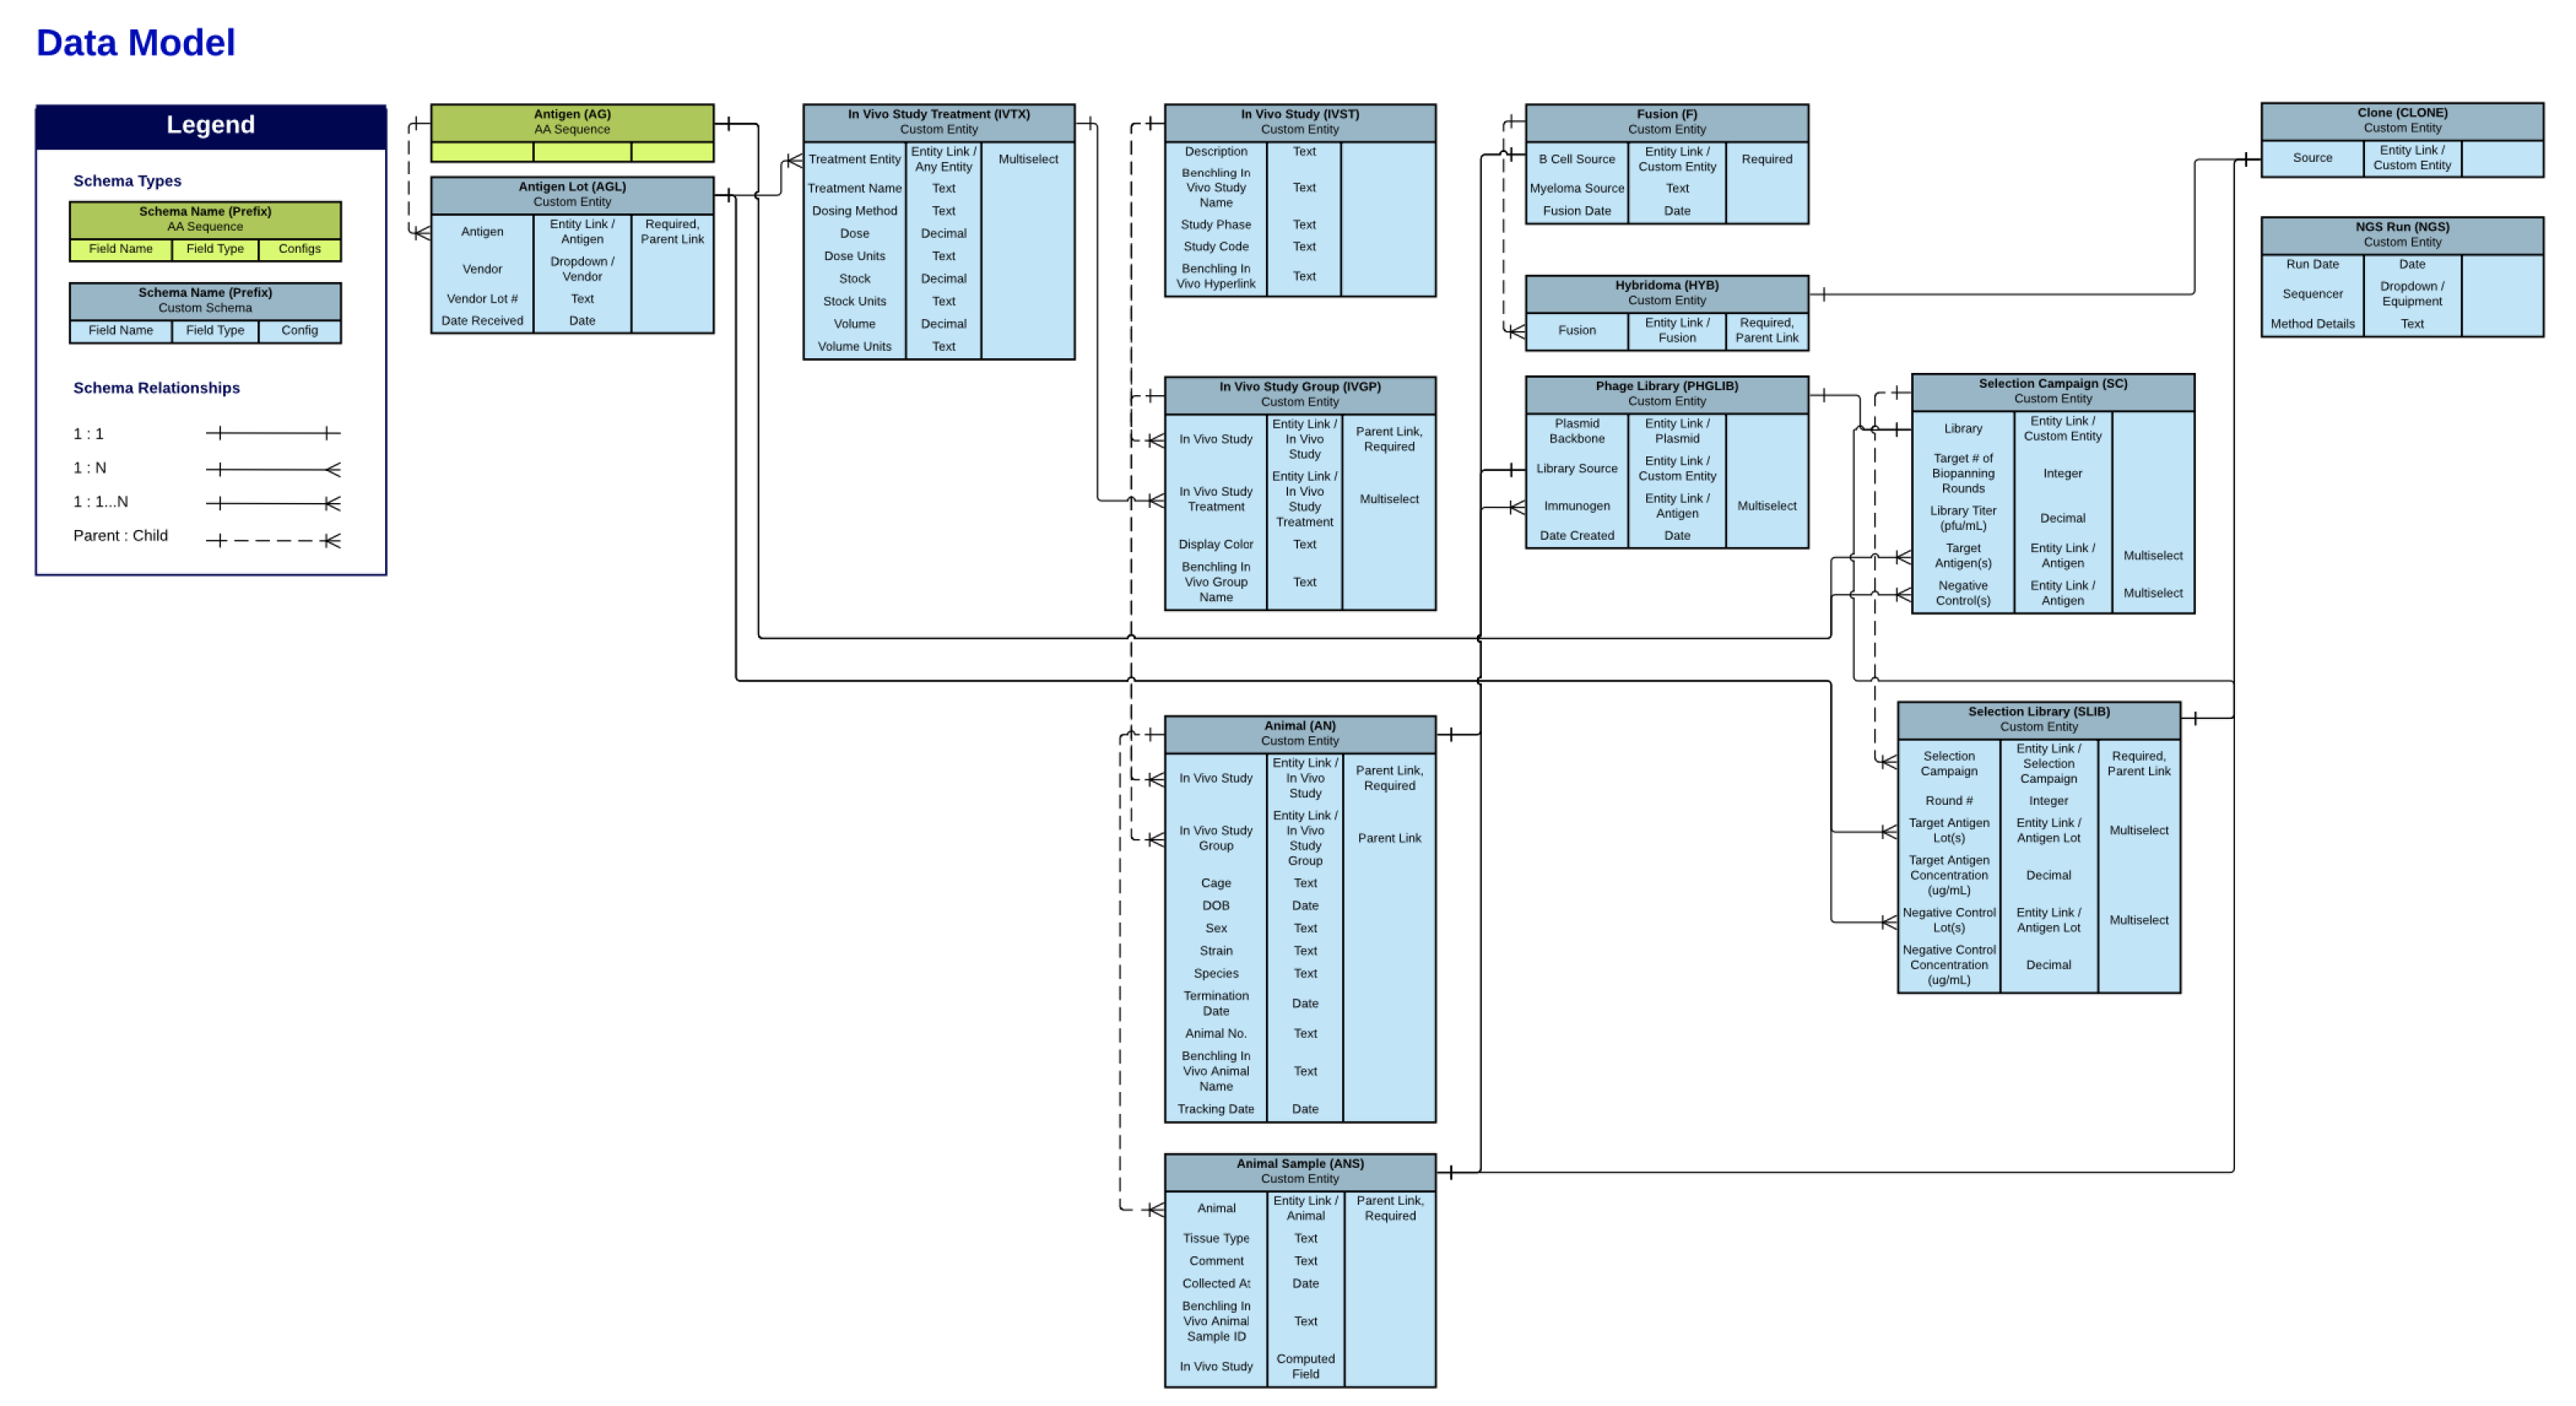
A key tool in this phase is the creation of an entity-relationship diagram (ERD). An ERD helps visualize your data model at a high level, showcasing how different entities (such as molecules, studies, and results) relate to one another and what attributes each entity will hold. For instance, an ERD might show which strain produces the highest protein yield, enabling researchers to easily navigate and query the dataset.
Below you can see a simplified example of an ERD showing schema types and their relationships to one another.
4b. Build
During the build phase, you’ll configure conceptual designs and specifications in the platform you’re using for data management. In Benchling, the build phase involves configuring the database objects (schemas), associated metadata (schema fields), and defining data relationships directly in the platform.
Configure your platform to fit your organization
In Benchling, a defined database object (schema) includes the attributes and relationships of the different types of data concepts important to your enterprise. Configurations are intended to capture data that is associated with experimental results, sample tracking, etc. Benchling’s point-and-click configuration offering allows an easy to learn, no-code, self-serve option for ongoing configuration updates.
Manage metadata
Metadata in a data model provides context and additional details about the data being stored, which is particularly important in scientific datasets, where each data point can have significant implications. Designing metadata for each database object (schema) involves defining how additional information like the source of data, date of collection, experimental conditions, and compliance information is captured and linked to core data. This ensures that critical context is captured for all data.
Establish data relationships
Next, define how different database objects are related to each other. For example, this enables organizations to link drug compound purification to the respective process development parameters, or connect genetically engineered strains with their source plasmids. Benchling allows organizations to easily modify and configure the platform as new scientific methods and data types emerge.
Finally, the build phase involves integrating your configured data model with other systems and tools across your organization. This may include connections to external databases, integrations with data collection tools like lab equipment software, and links to analysis and visualization tools. Benchling’s extensibility ensures that data can flow seamlessly across all parts of your technology stack, enhancing usability of your data model to support your R&D.
4c. Test
The test phase makes sure that the data model not only functions as intended, but also supports the needs and experiences of users to enable real-world workflows. Below, we cover the various types of testing that are instrumental when refining your data model for use: unit testing, functional testing, and user acceptance testing.
Unit testing
Unit testing involves breaking down the data model into its point functional units and testing each for usability. This typically includes testing a logically selected group of database objects to validate a specific scientific use case or use case step. The goal is to ensure that each unit performs as expected under in scope conditions. By isolating each part of the model, developers and admins can more easily and efficiently pinpoint significant issues, which simplifies troubleshooting.
Functional testing
While unit testing focuses on the individual components, end-to-end functional testing evaluates the holistic functionality of the data model. This testing simulates real-world usage scenarios to ensure that the entire system works as you expect. Testing might involve mimicking the sequence of steps a scientist would take from data collection, through analysis, to generating actionable insights. End-to-end testing is crucial for verifying that your data model meets your organization’s workflow requirements and data handling needs.
User acceptance testing
User acceptance testing (UAT) is the final step before rolling your data model out to your organization. This phase involves additional stakeholders that are representative of the full span of use cases for the platform. This group should test the model in a controlled environment. UAT helps ensure that the data model meets your functional specifications and aligns with your team’s expectations. Feedback from users during this stage is critical, as it provides direct insight into how well your data model enables day-to-day tasks. Make refinements based on this feedback to make sure it’s easy for scientists to use your model.
5. Drive adoption of your data model
A critical part of implementing a new data model is making sure that your company is set up to use it in the future. This starts with establishing a data-driven culture and ensuring teams see value from collected data. To set this in motion, institute an ongoing training and enablement strategy, so that as teams grow and evolve, all your teams have the data literacy they need to do their work.
Your data model must be custom-fit to your organization
Every company’s R&D is unique, and their data model should be too. We’ve found this step-by-step process of developing a curated, organization-wide data model has been consistently successful. We hope these can serve as a helpful guide for you too. If you’d like support along the way, you can reach out to the Benchling team, and we’ll be happy to help.
The State of Tech in Biopharma Report
Explore how biopharma is adopting AI in our report based on interviews with more than 300 biopharma R&D and IT experts.