Non-antibody scaffolds and peptide therapeutics

Here we use the PipeBio for sequence analysis of affibodies – non-antibody scaffolds from ERR3474167.fastq downloaded from the European Nucleotide Archive. These non-antibody scaffolds can make great therapeutics due to their small size although there can be tradeoffs.
Introduction
Biologic drugs are increasingly becoming important as therapeutics for treatment of various diseases, including cancer, infectious and inflammatory diseases. Classical antibody scaffolds and structures are being challenged by smaller but equally potent molecules named "non-antibody scaffolds" which have a number of benefits over the large bulky IgG molecule. Non-antibody scaffolds are interesting as therapeutic drugs thus the rich interest in these scaffolds (Frejd, F. et al). Many different and interesting scaffolds exist but here we only focus on a few of these.
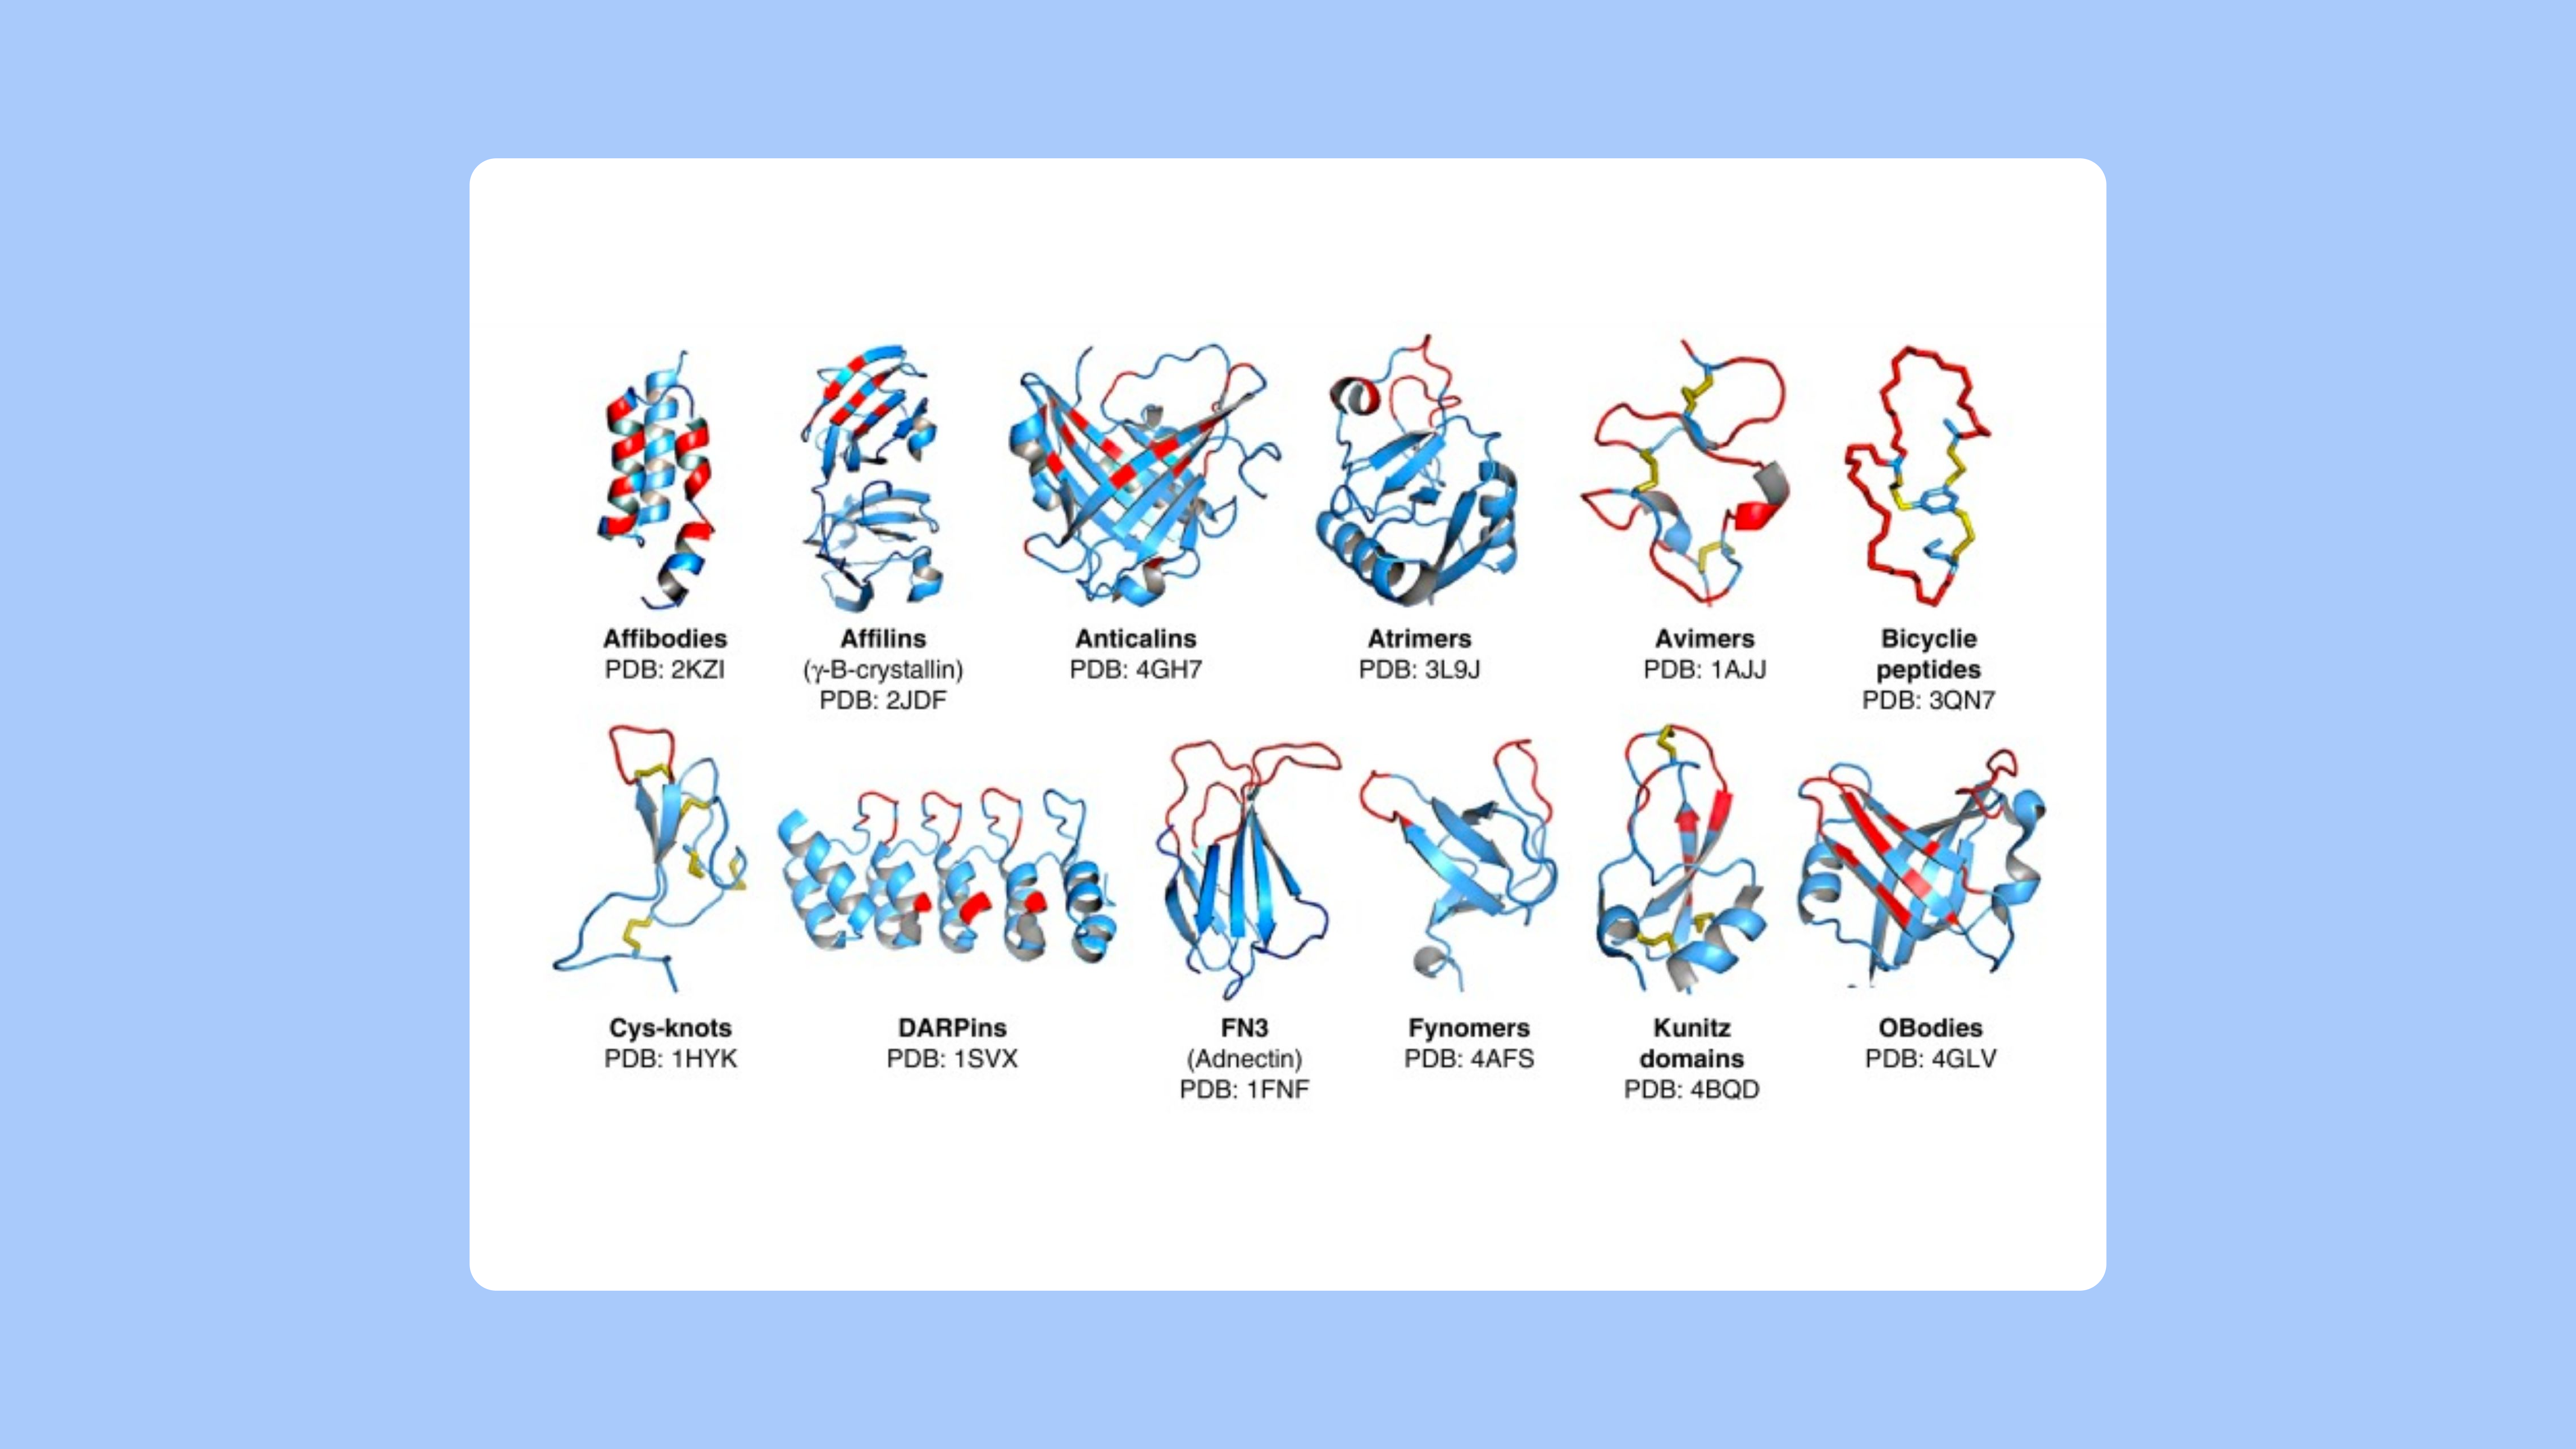
Figure 1. Short peptide three-dimensional structures. From Vazquez-Lombardi et al.
Traditionally, there has been very little interest in developing general software tools to cope with these non-antibody scaffolds and companies and academic research groups have often analyzed data by hand or used internally developed software. Analysis of high throughput (NGS) sequencing data of these scaffolds has been a very challenging task.
Pipebio offers a very easy to use cloud based sequence repository and bioinformatics platform which can easily be configured to fit various annotation requirements for both antibodies and non-antibody scaffolds.
In this application note we have primarily focused on analysis of affibodies but the platform can very easily be configured to other scaffolds such as knottins, bicyclic peptides, DARPins etc.
Data and configuration
We have used the first 2 million affibody sequences from ERR3474167.fastq downloaded from the European Nucleotide Archive. Bioproject https://www.ebi.ac.uk/ena/browser/view/PRJEB33942 which have been sequenced on the Illumina MiSeq platform.
Scaffold configuration
Before running the annotation pipeline, there is a one-time configuration of the required scaffold. A scaffold can be IgG, ScFV, nanobody, non-antibody scaffolds etc. and below we show a simplified example of an affibody scaffold. As part of the scaffold configuration it is also possible to specify any liabilities, disallowed frameshifts, stop codons, etc. and how this should be reported in a tabular output.
Multiple scaffolds can be configured allowing for different configurations.
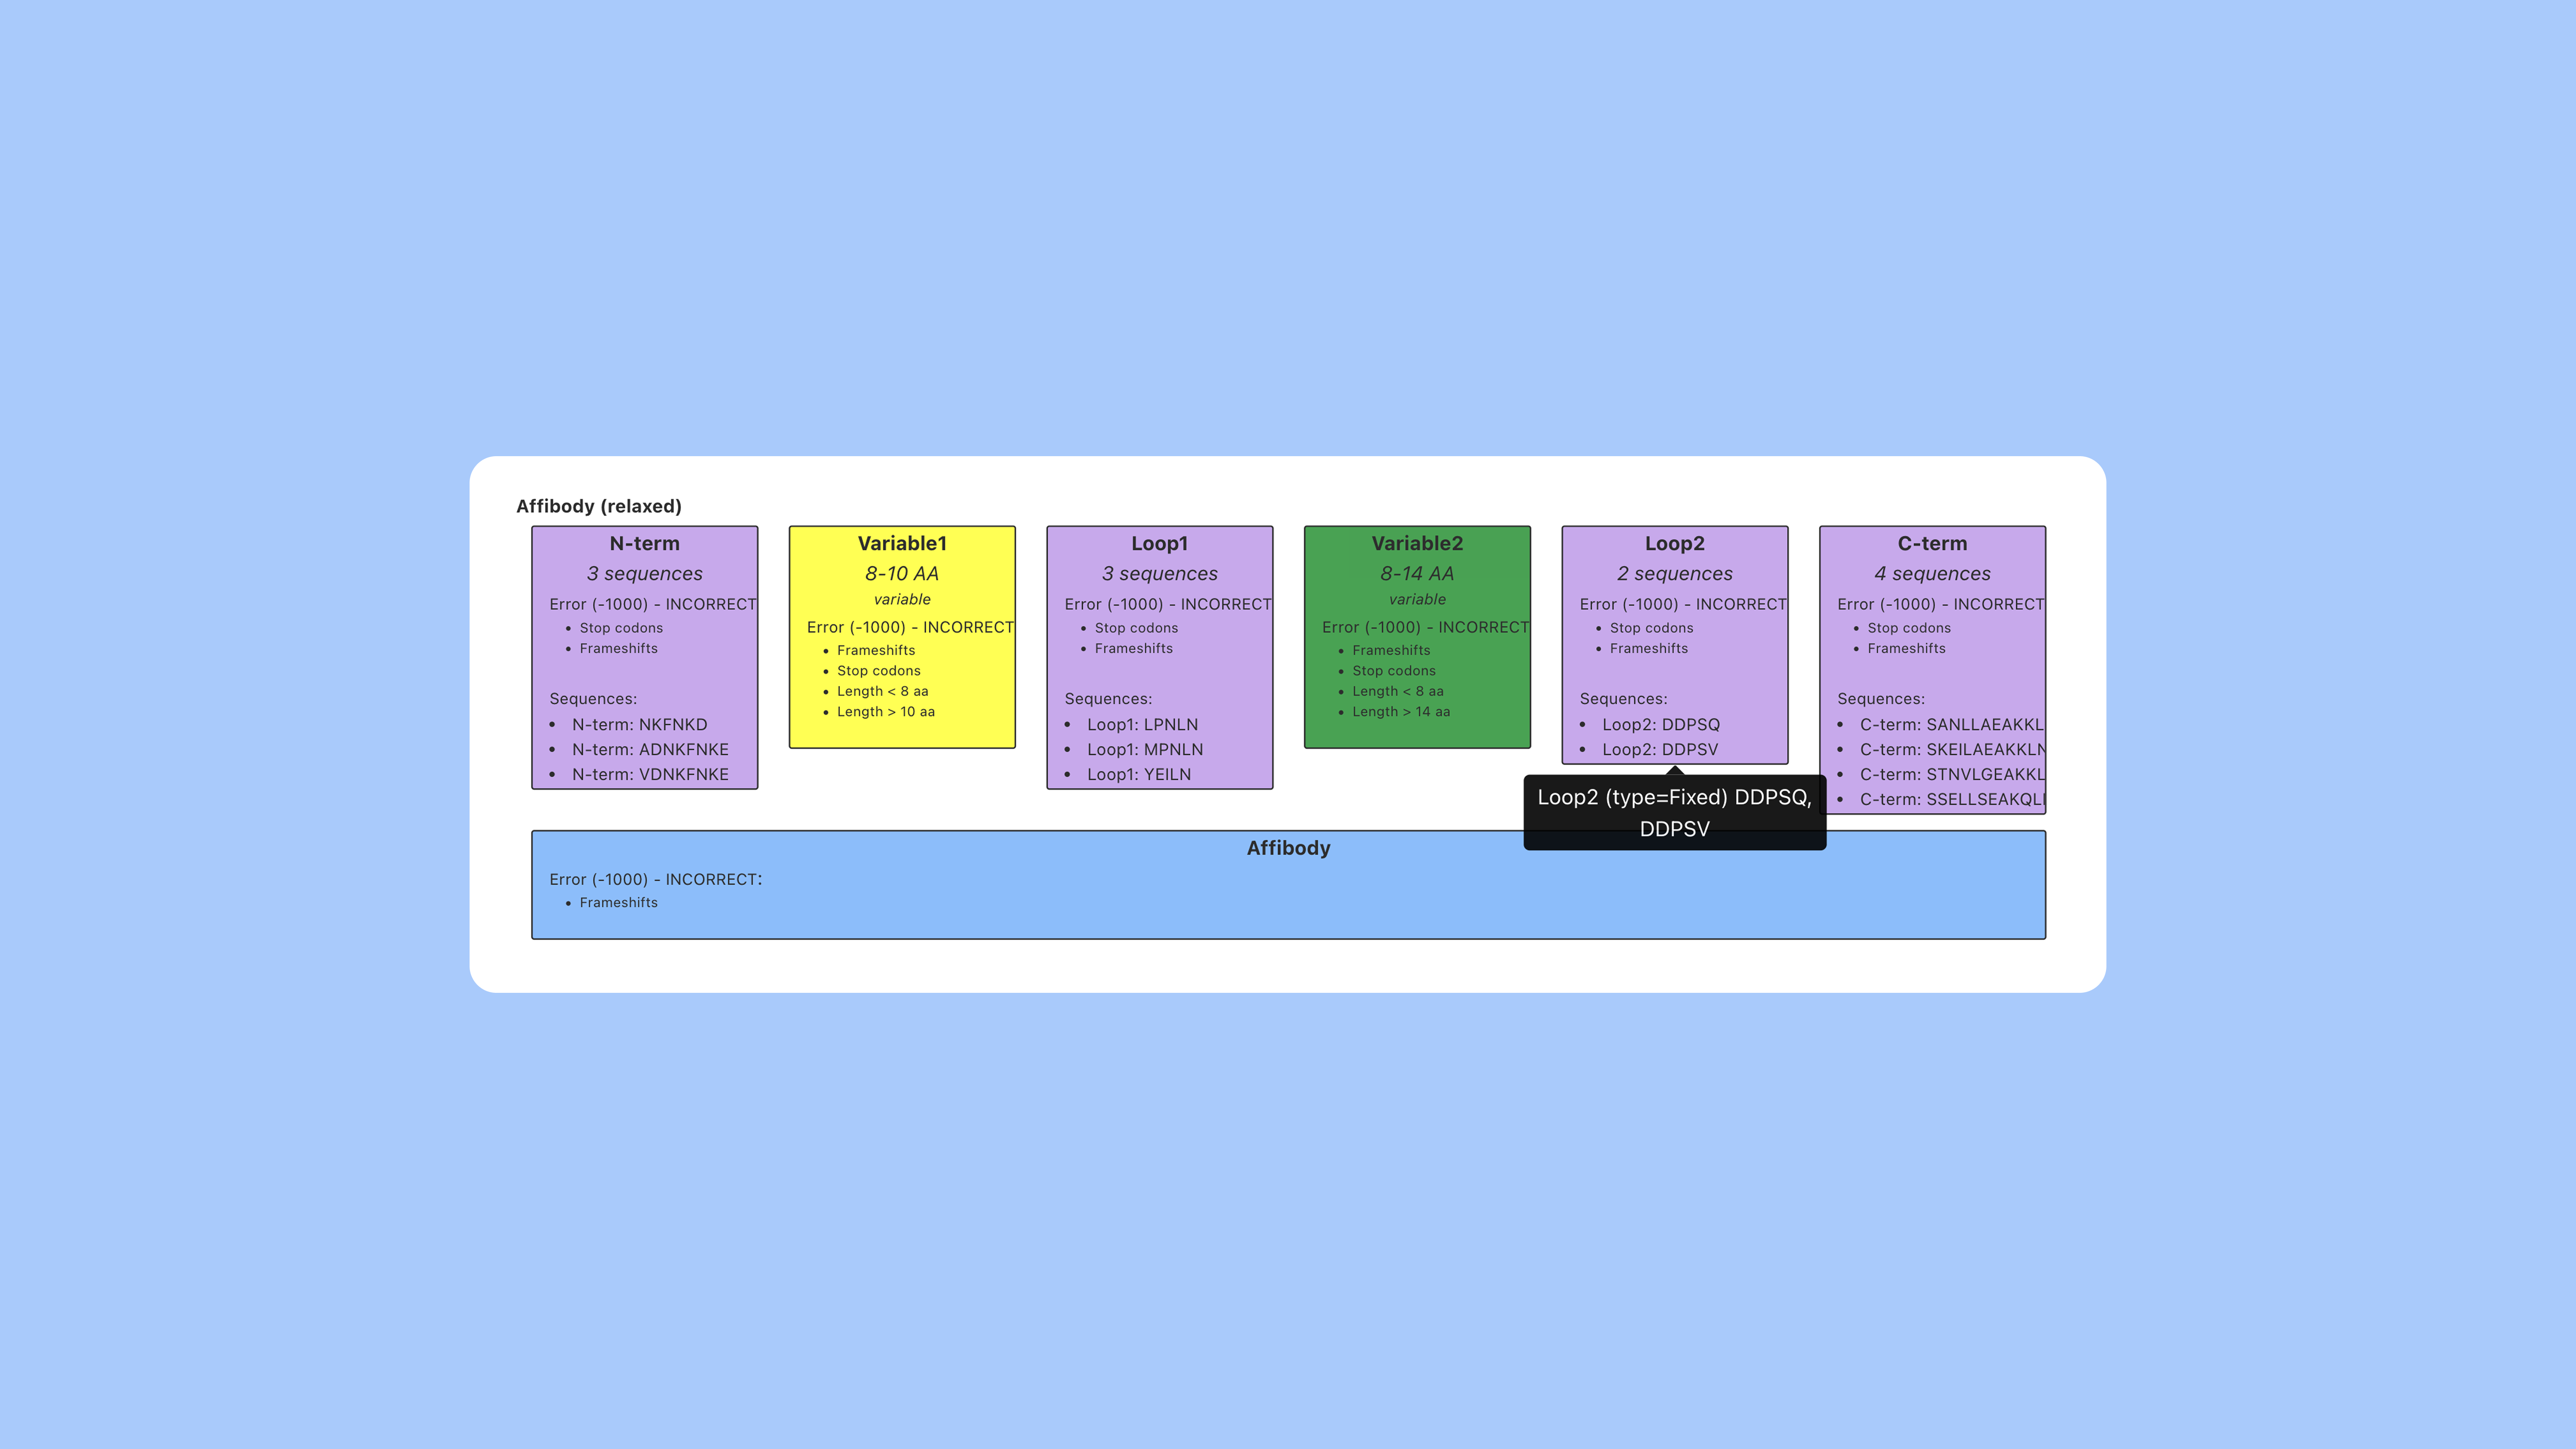
Figure 2. Schematic view of the affibody scaffold. Scaffolds and associated rules can be customized in PipeBio to identify regions and sequence motifs.
Analysis pipeline
The PipeBio platform has a large toolbox for analyzing data and the use of those may be dependent on the biological application. Here we show a simple workflow where we have imported sequence data, annotated interesting regions, plotted different charts and clustered on the region of interest.
Annotation results
The initial output of the annotation pipeline is a result document which shows tabular information on the results aligned with the sequences represented in a graphical view. This enables the user to easily filter and visually inspect the data in great detail. The annotation results are accompanied with a graphs showing breakdown of identified liabilities and overall summary statistics.
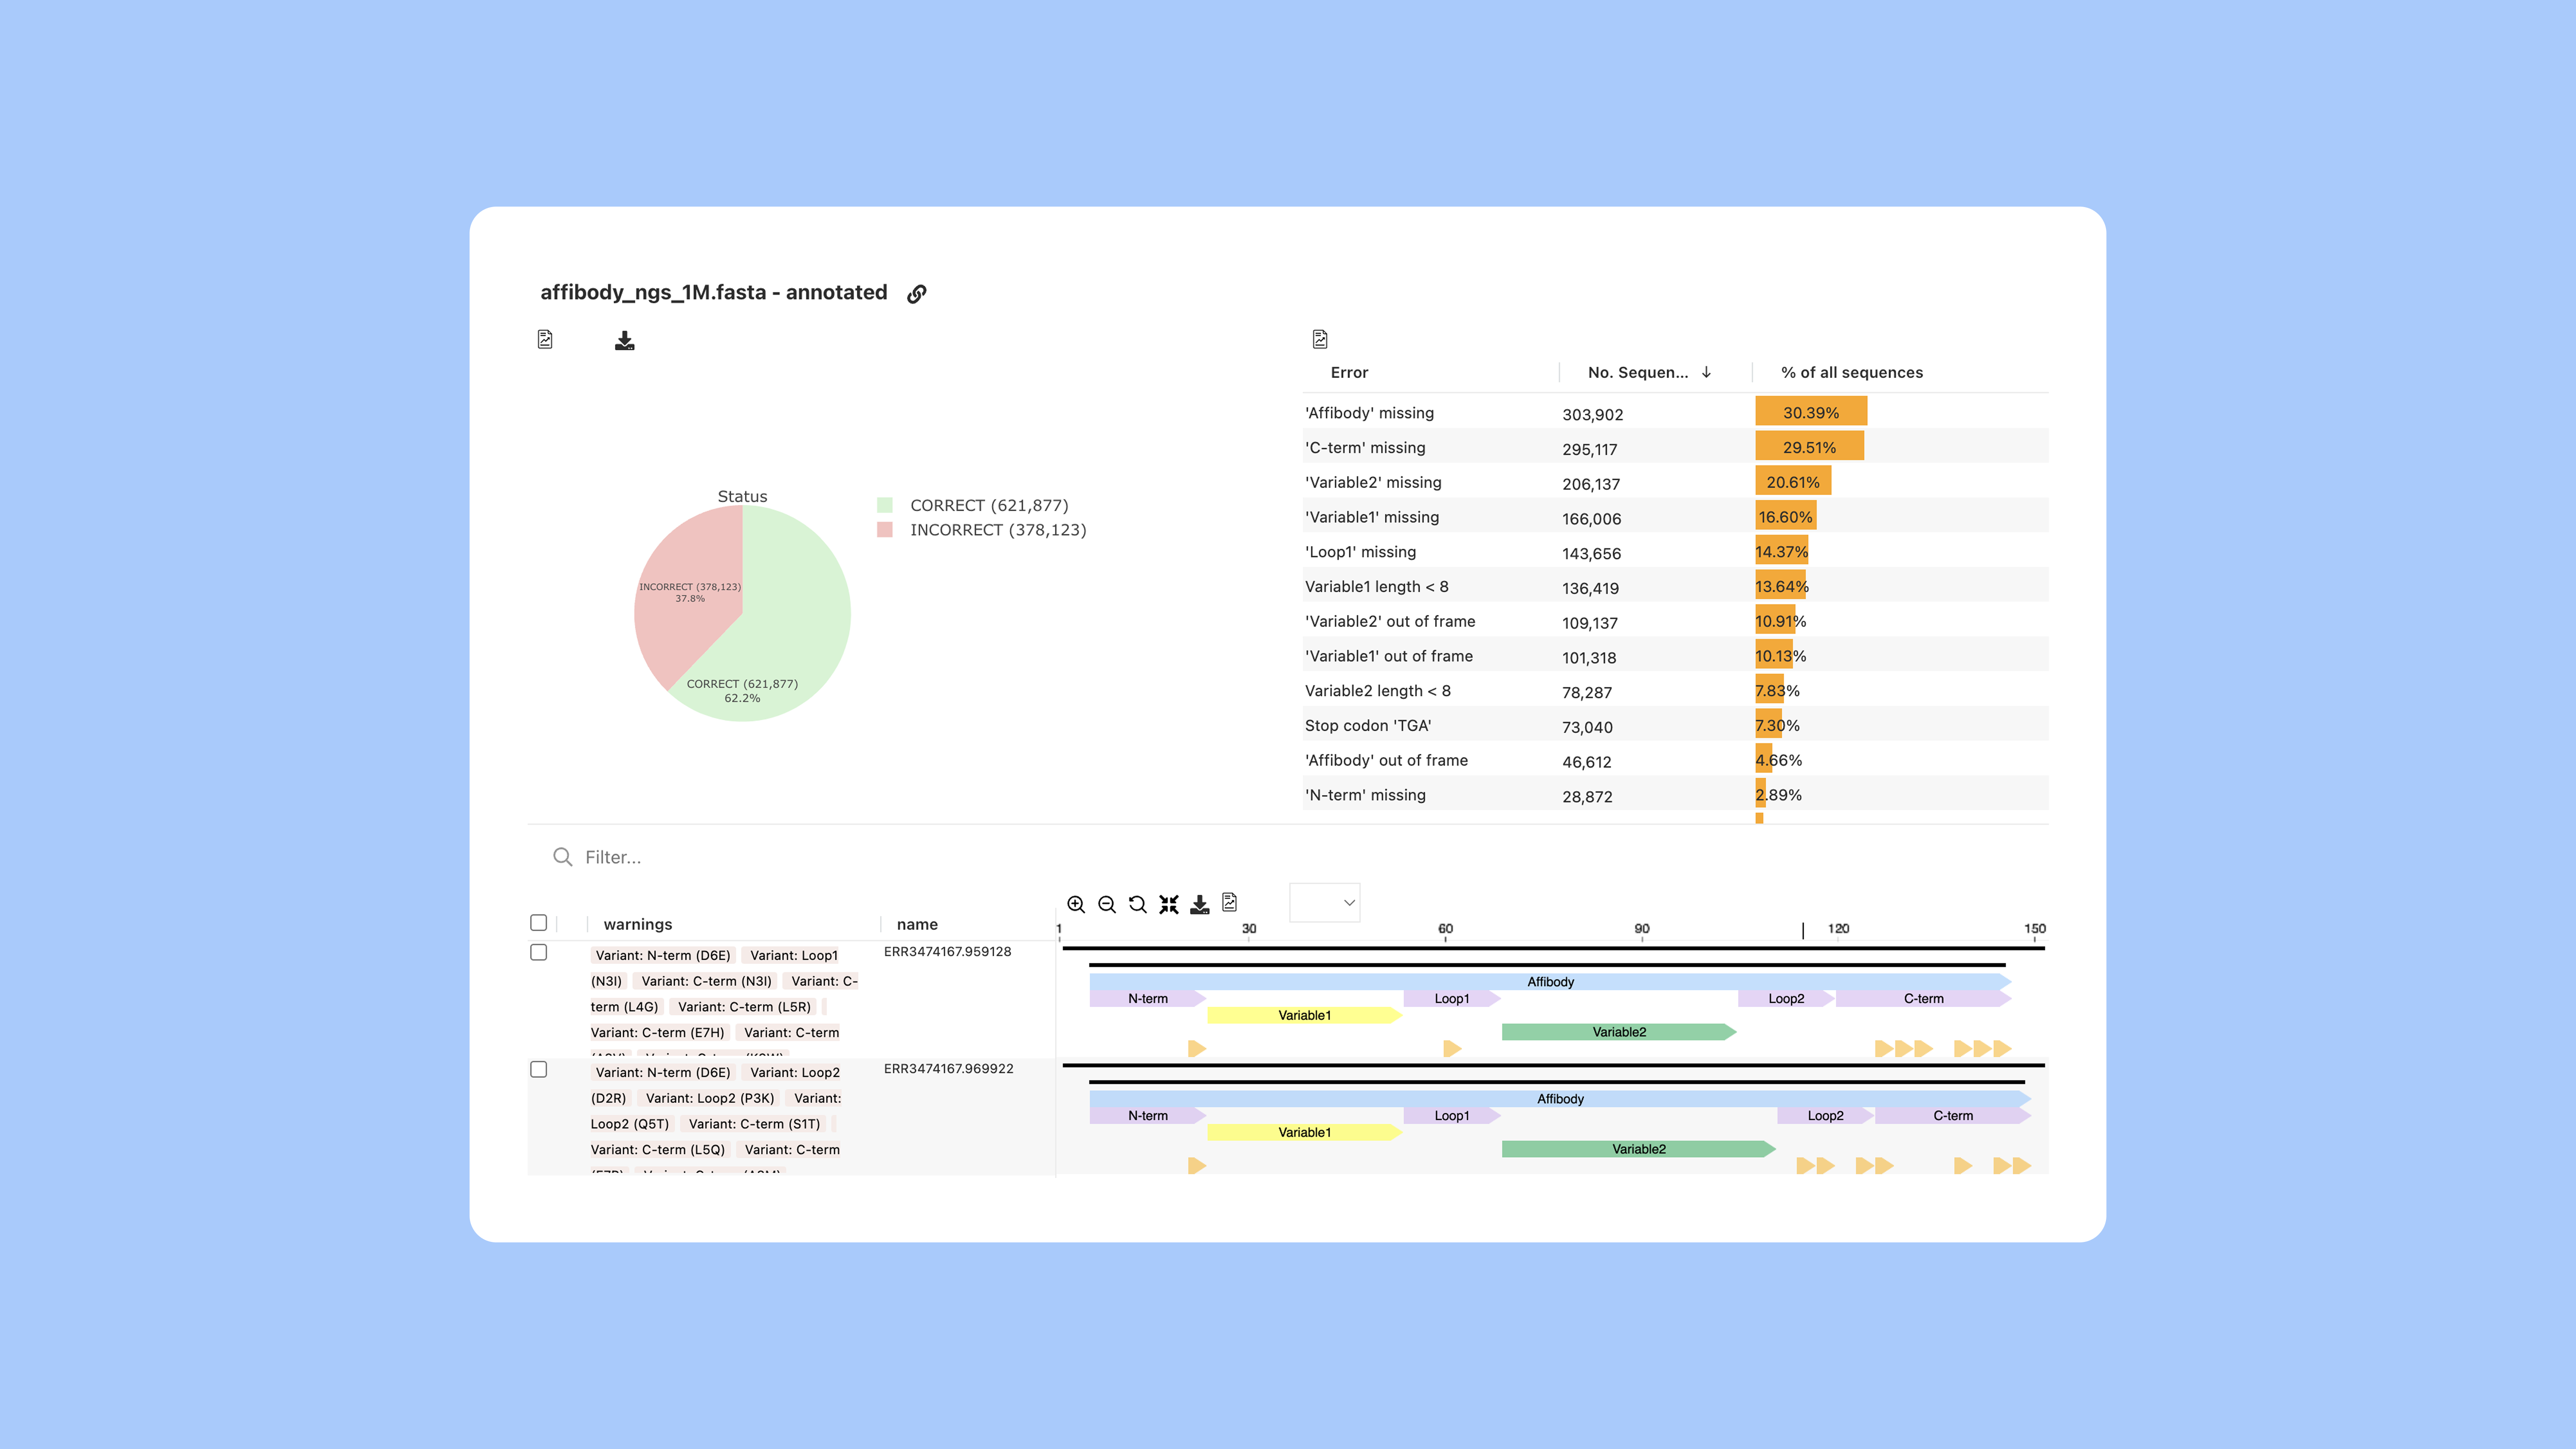
Figure 3. Pie chart showing summary of the annotation pipeline and individual identified errors as a tabular representation. Annotated sequences are shown in the lower half of the screen with both tabular information as well as graphical sequence view.
Charts
For visual inspection and support of your analyses it is possible to plot various charts. All charts and analyses can be performed per annotated region or the full sequence. All chats are interactive and by clicking different regions of the chart will apply a relevant filter to the result table of both tabular and sequence data. For example, for synthetic scaffolds and affinity maturation it is very valuable to be able to click interesting codons in a codon usage plot or by clicking a certain sequence length in a length distribution chart.
A number of different charts are support and others can be added on request
Codon usage
Length distribution
Sequence logo
Amino acid heatmap
And more
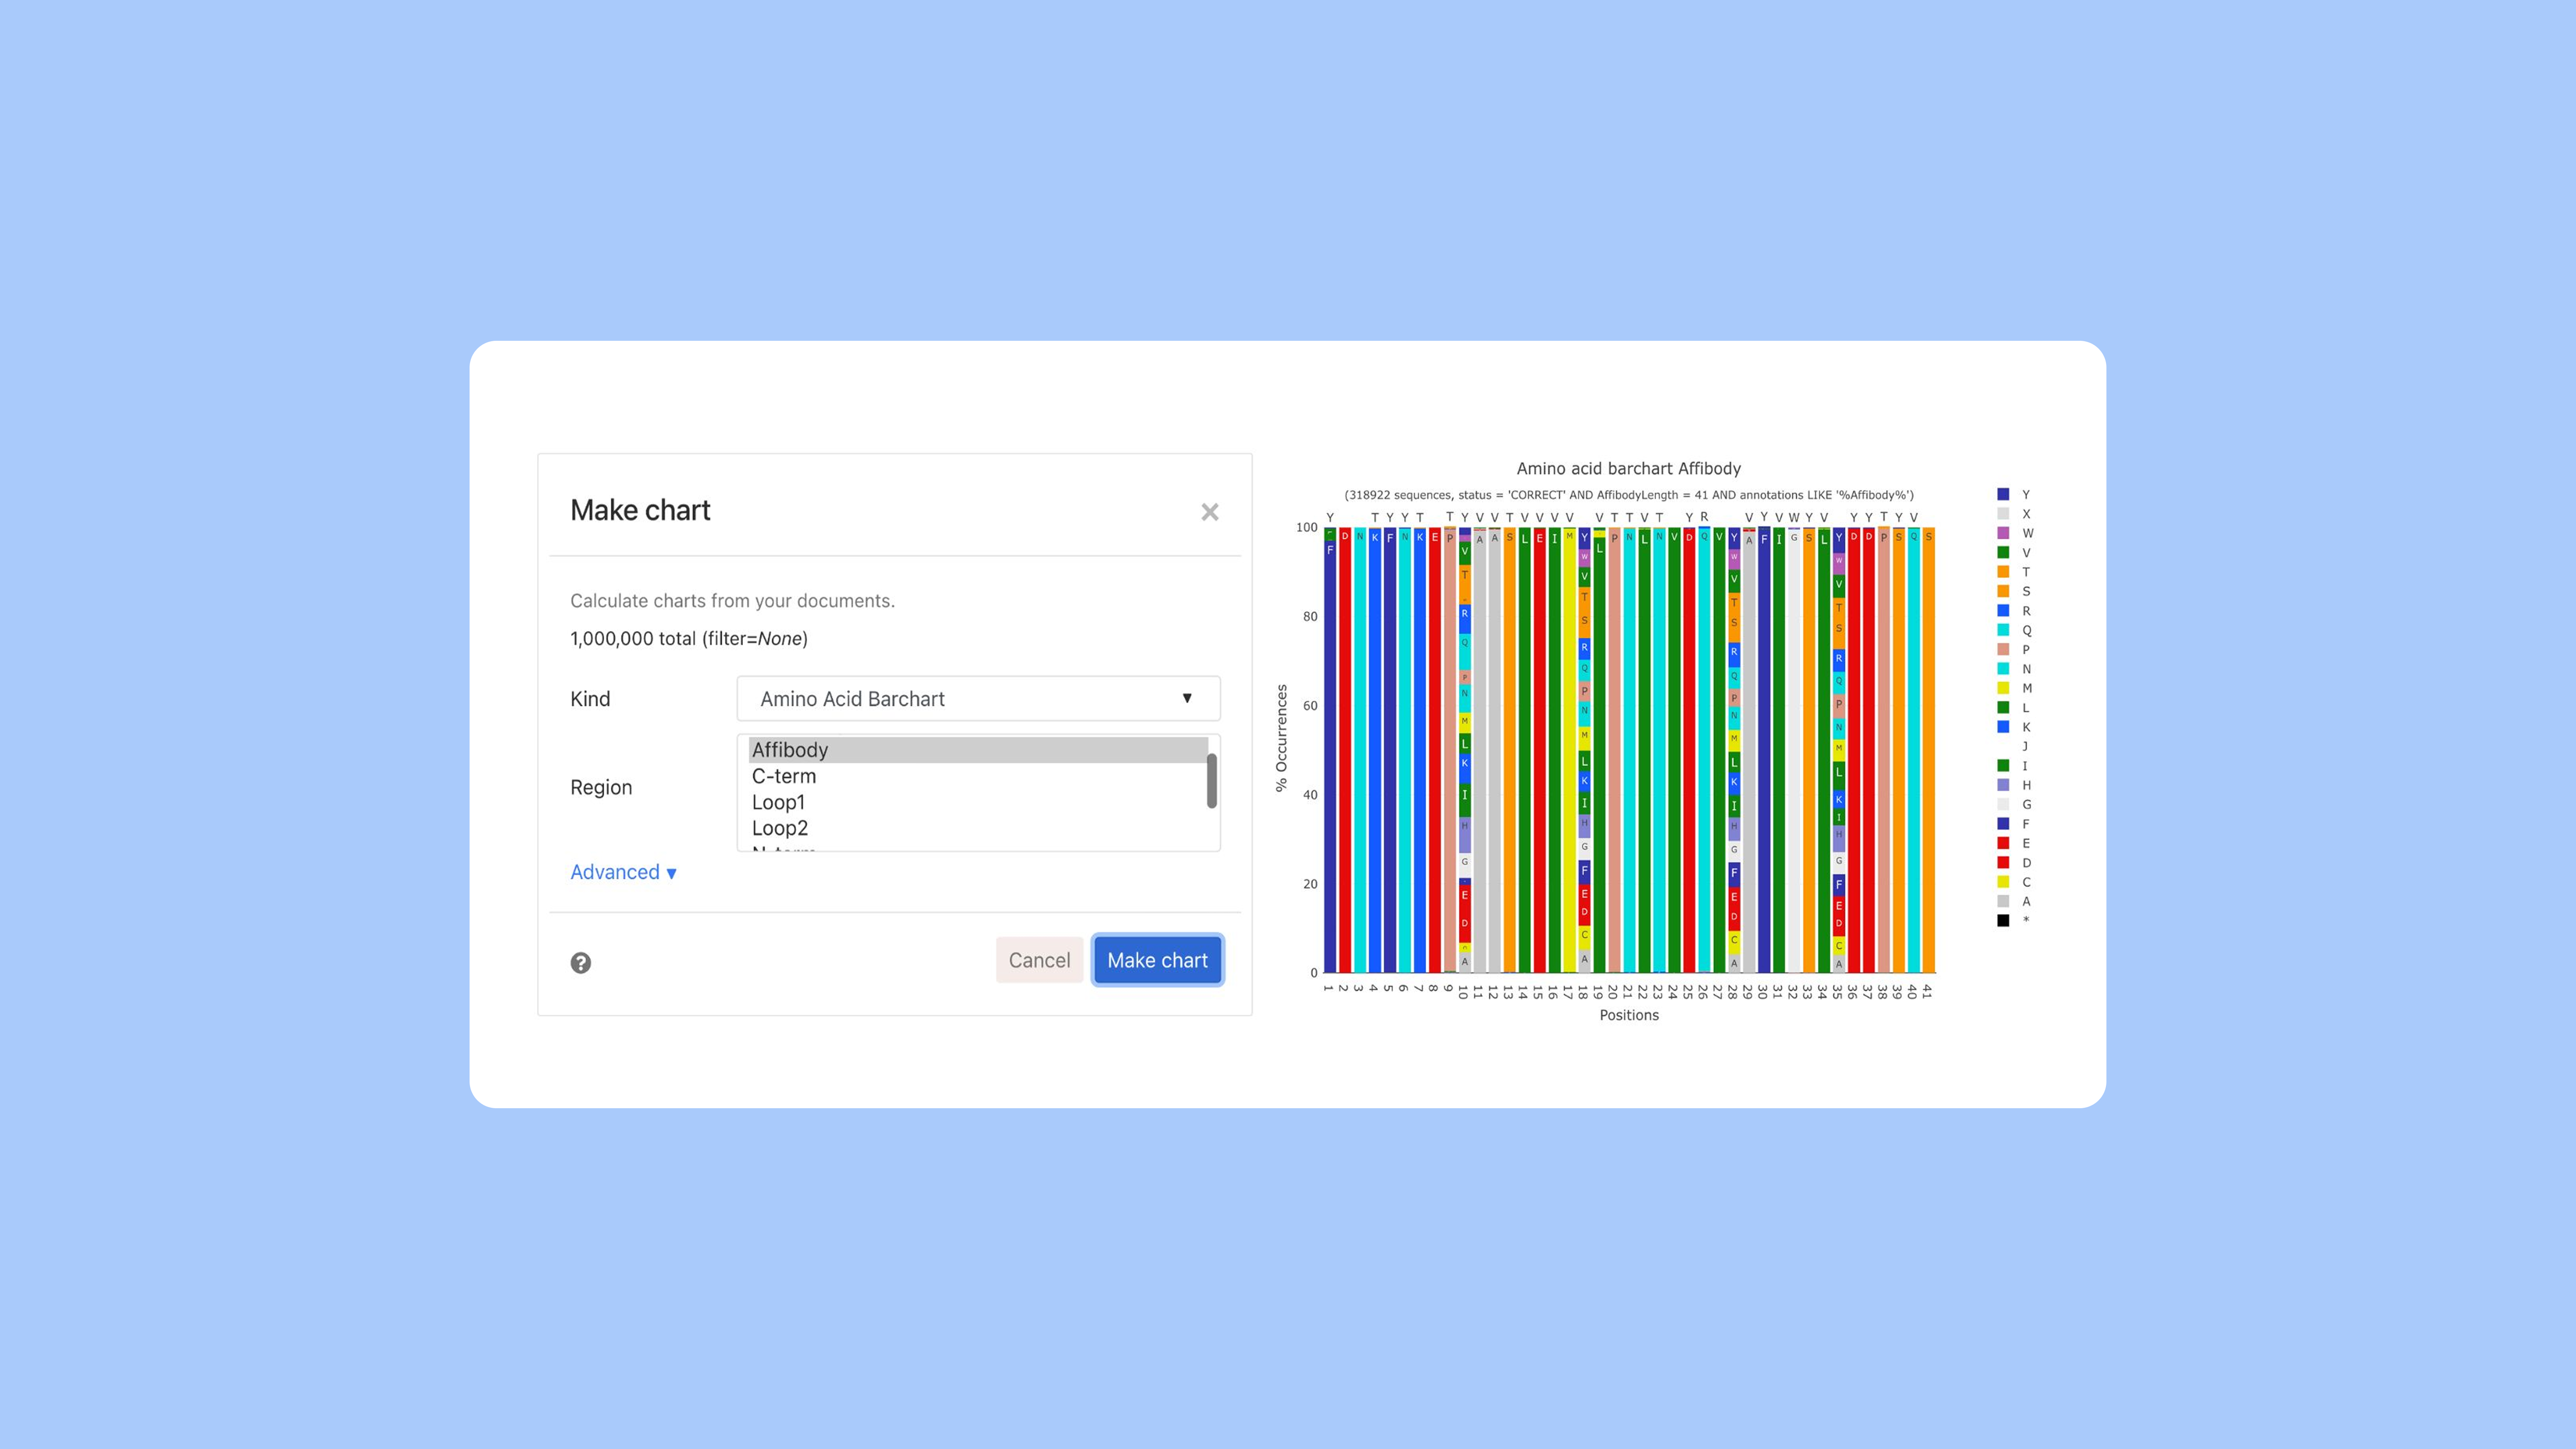
Figure 4. Creating an amino acid barchart of a specified affibody region on PipeBio.
It is very easy to see from the barchart that there is a high variability in position 10, 18, 28, 35 in the sample. Below is an example of codon usage which can be used for library QC. The chart is interactive and will retrieve the selected sequences when a chart component is clicked.
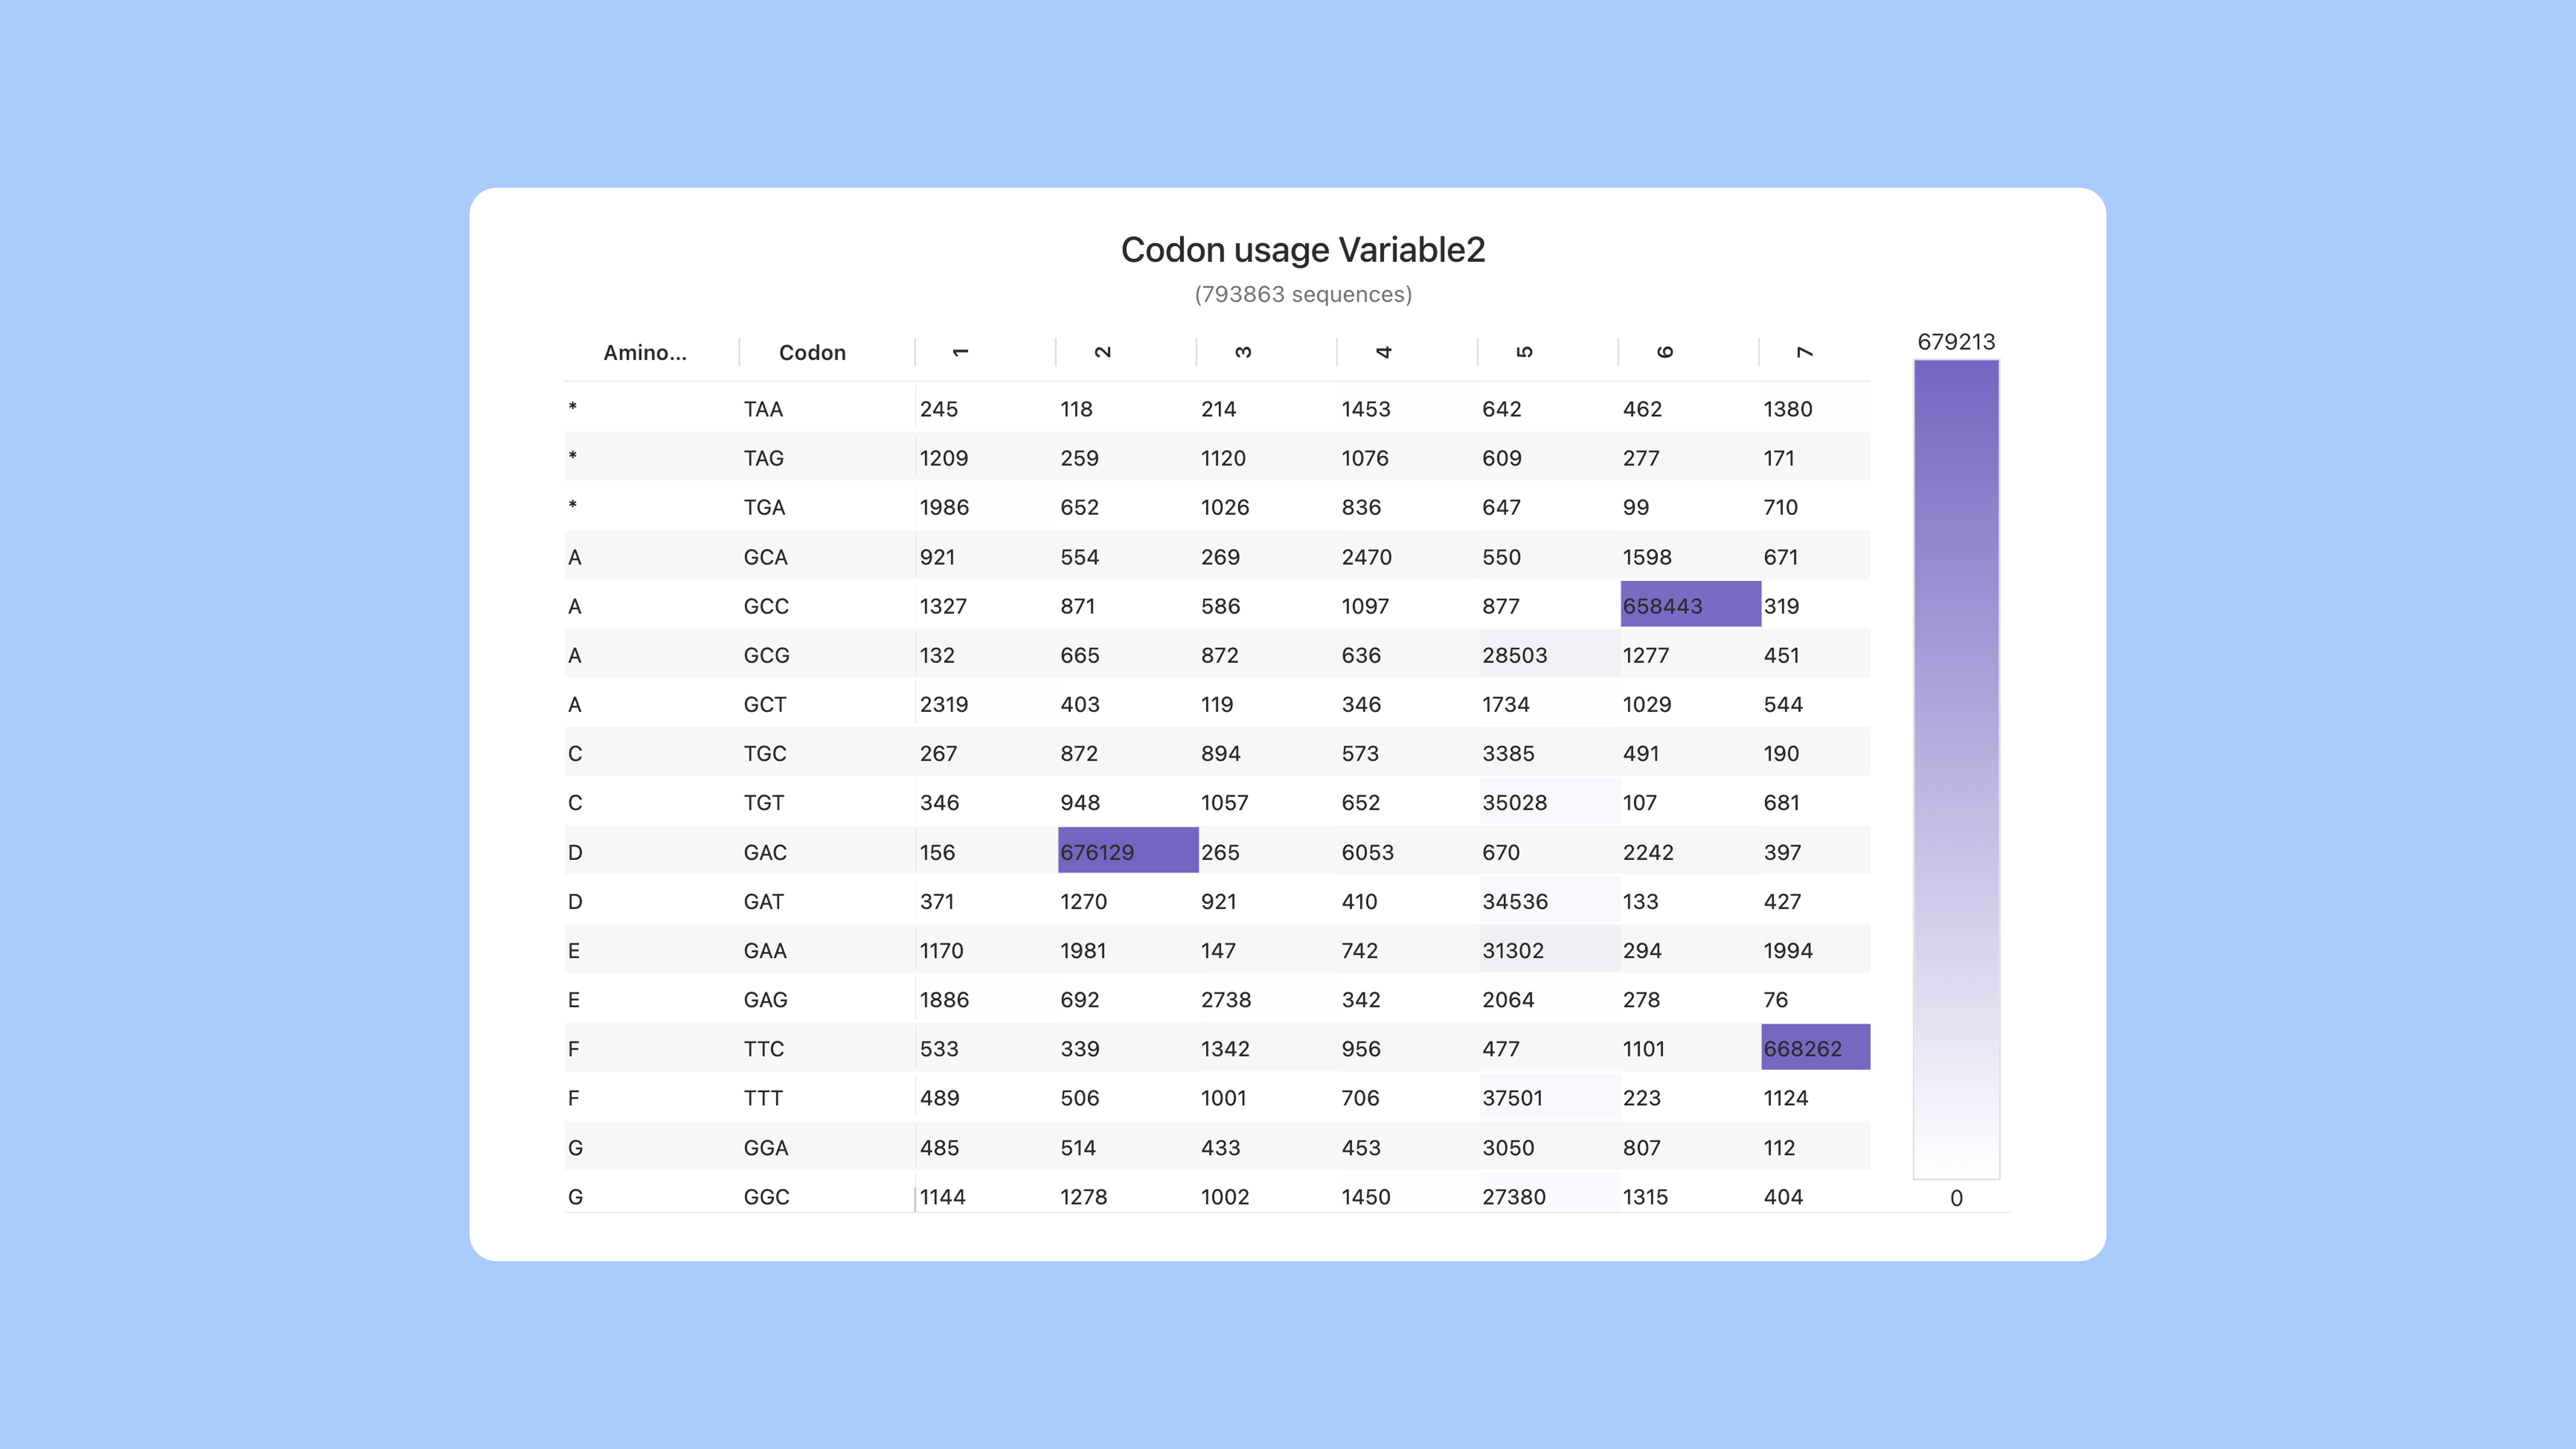
Figure 5. Codon usage table in PipeBio Bioinformatics Cloud Platform.
Clustering
Reducing data complexity by clustering is a great way to get a condensed overview of the data and reduce data redundancy.
On PipeBio, the user is able to “slice and dice” and have different views on clustered data. In the following screenshots we only look at the overview of the clusters, but it is also possible to expand the content and look into more details of the individual sub-clusters.
From the 2 million annotated sequence and using 85% identity clustering, we find 4651 clusters in total. The largest cluster has 328,492 sequences comprising 108,498 unique sequences. There is at most 255 identical sequences in that cluster indicating a very high diversity.
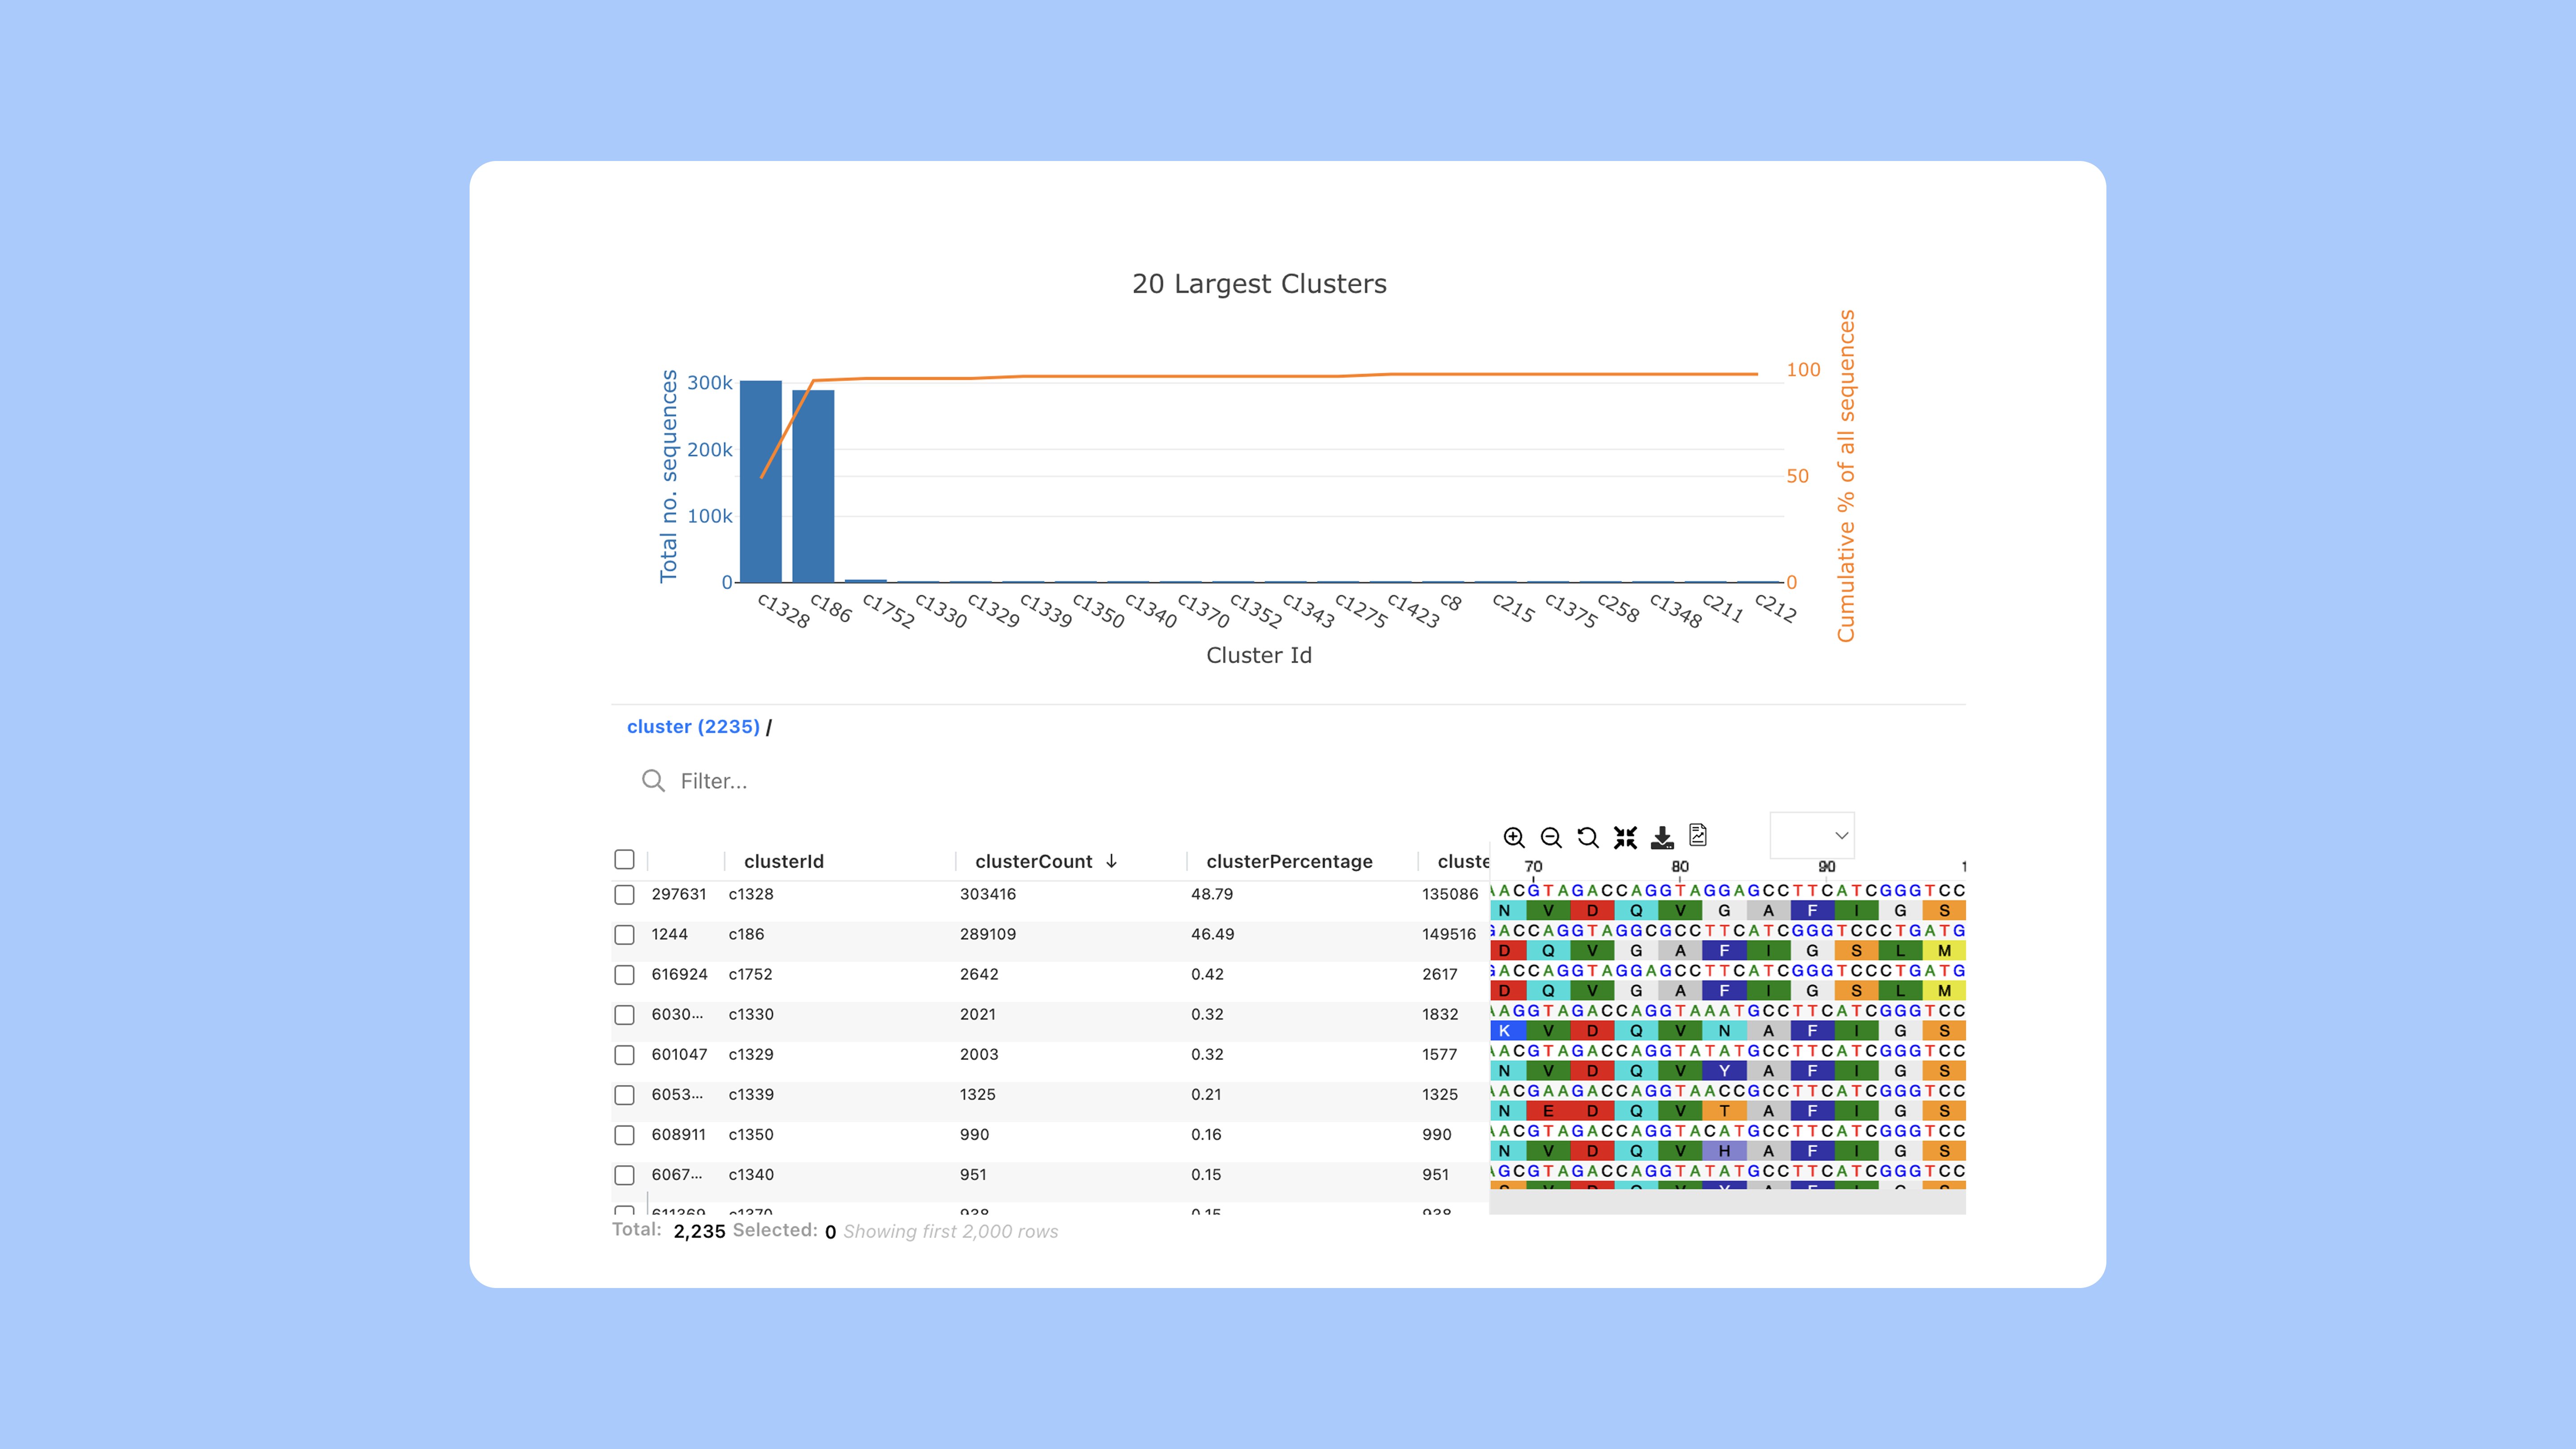
Figure 6. The clustering resulted in the majority of sequences clustering under two dominant clusters. The top pane shows the largest clusters and while the table below shows cluster sizes.
Cherry pick alternative-scaffolds to the cart
Use the sequence cart to cherry pick interesting sequences and clones and store them for later use or download them directly.
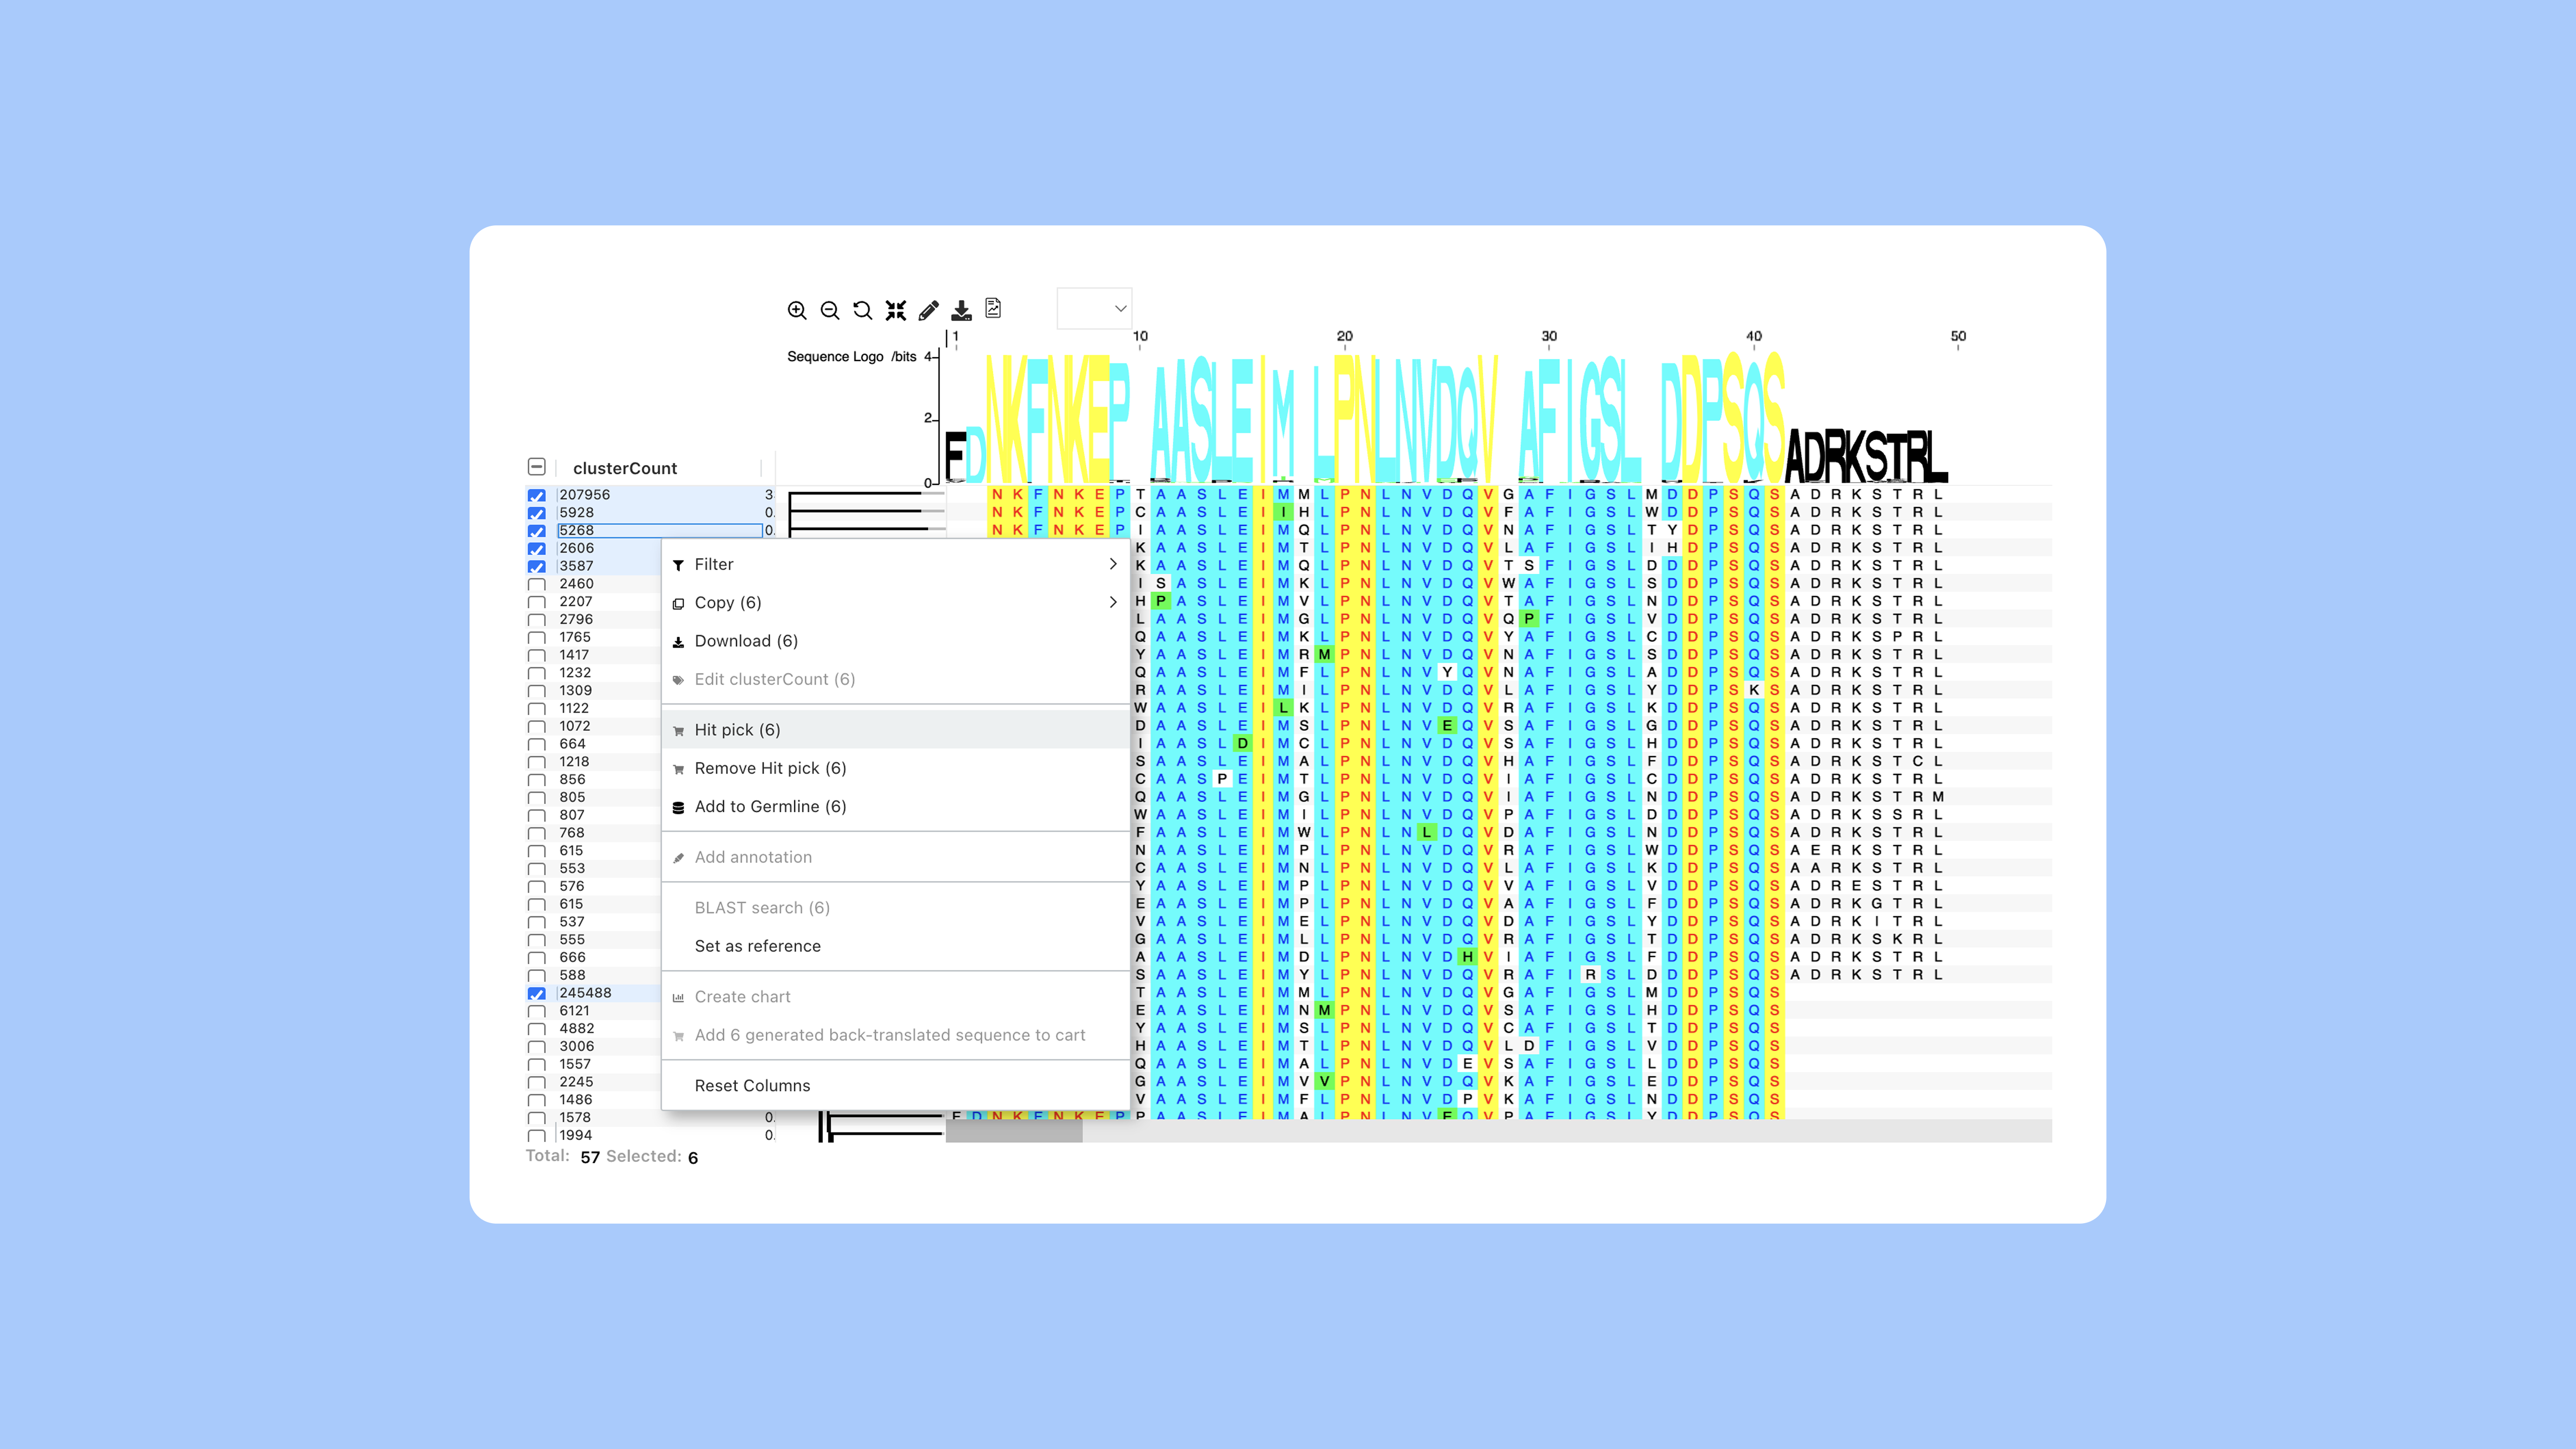
Figure 7. Right click in any document within PipeBio to add interesting sequences to the car .
Customize your Sequence Store for alternative-antibody scaffolds
After cherry picking it may be interesting to query to the Sequence Store which is a repository of all the sequences you have analyzed before. That way you can very quickly identify if you have analyzed identical sequences before and in which documents they are found.
This can also be used, as example, to store patent sequences and other data from public sources. Then it is very easy and quick to look up if the sequences you are currently analyzing has already been found in the public domain.
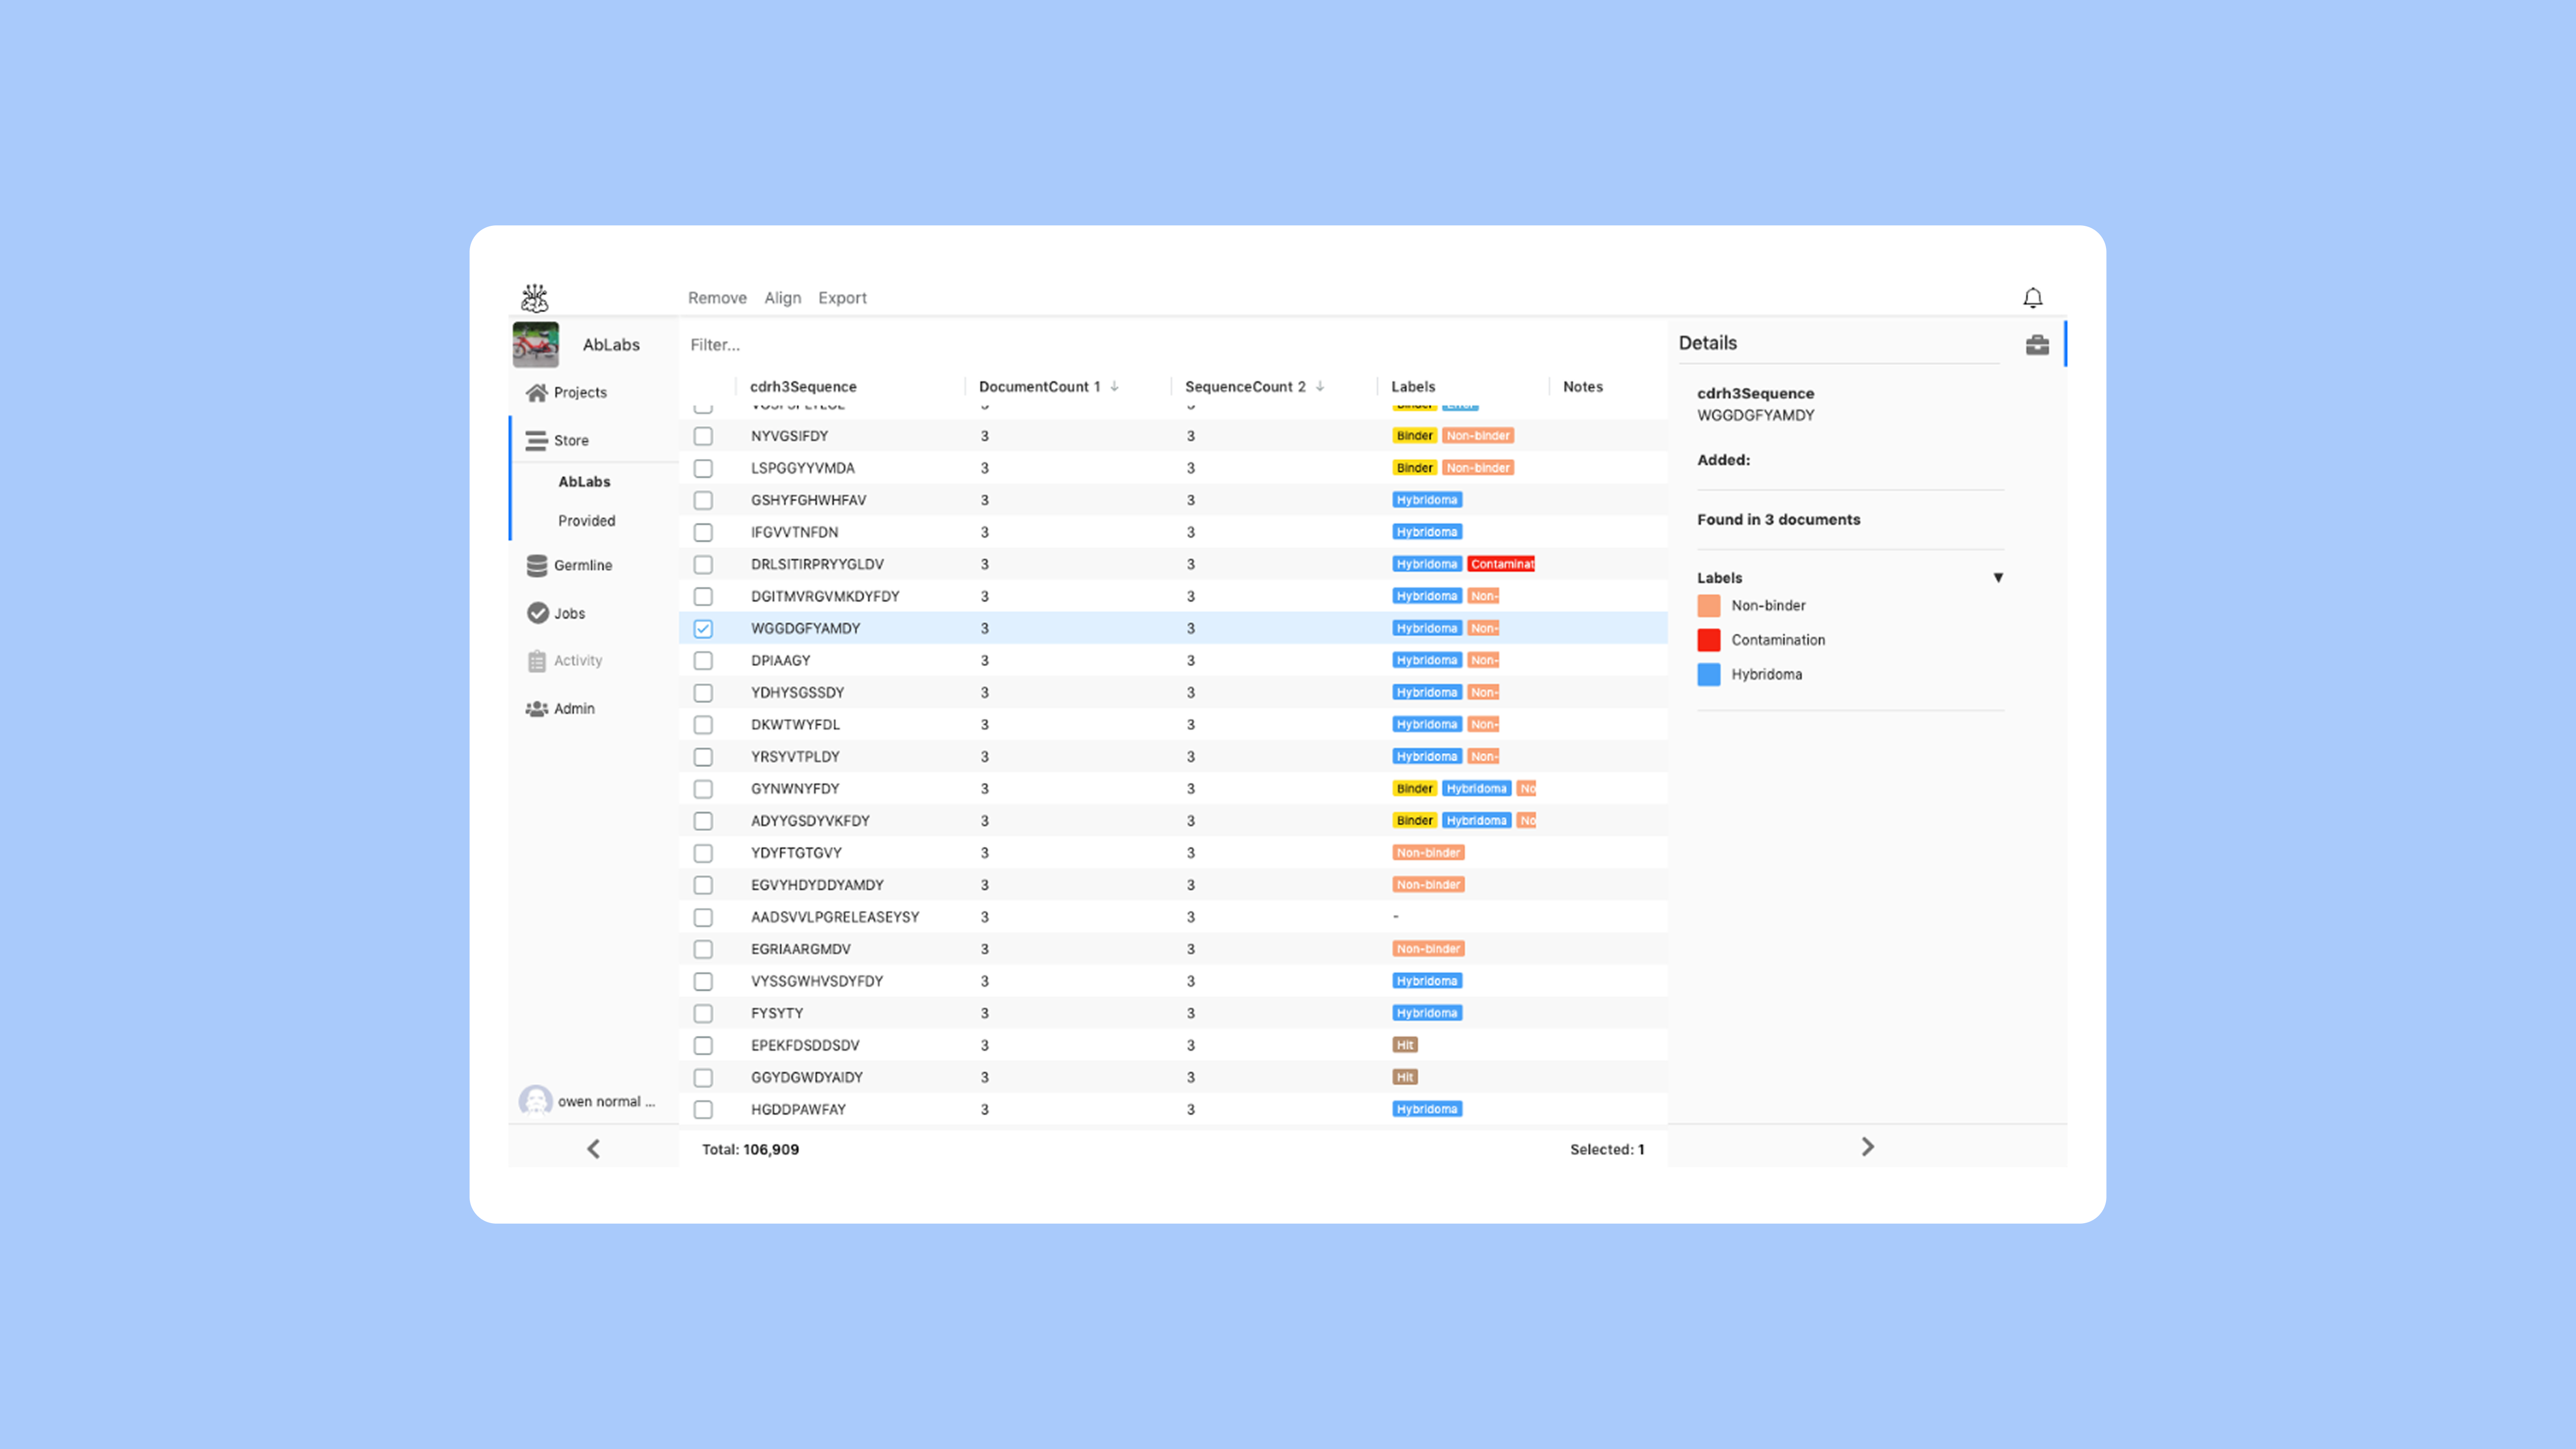
Figure 8. Sequence Store showing antibody CDR-H3 sequences and labels.
A rich integrated bioinformatics suite for antibody and antibody-like drug discovery
There is a lot which is not described here and more is being added all the time.
API for integration with other systems
Merge paired-end NGS data
Screen immune repertoires to extract variants having potential in-vitro maturation sites and residues
Compare multiple samples, eg. enrichment, panning or to improve potency
Subtract one sample from another
Reporting
Labeling of sequences
Cloning
And a lot more
References
Vazquez-Lombardi, R., Phan, T. G., Zimmermann, C., Lowe, D., Jermutus, L., & Christ, D. (2015). Challenges and opportunities for non-antibody scaffold drugs. Drug Discovery Today, 20(10), 1271–1283.
Frejd, F., Kim, K. Affibody molecules as engineered protein drugs. Exp Mol Med 49, e306 (2017). https://doi.org/10.1038/emm.2017.35